

68 An Extreme Event of a Mesoscale Dust Front—A Case Study Over …
429
0
500
1000
1500
2000
2500
0.0
0.5
1.0
1.5
2.0
Z [m]
TKE
(b)
1130
1230
1330
1430
0
500
1000
1500
2000
2500
0.0
0.5
1.0
1.5
2.0
Z [m]
TKE
(a)
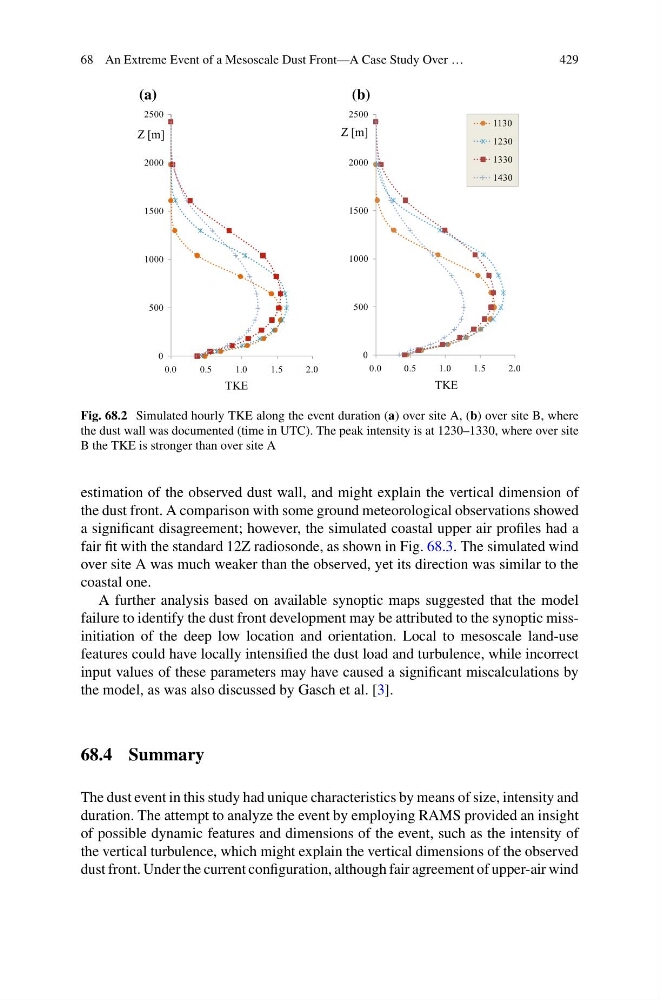
Fig. 68.2 Simulated hourly TKE along the event duration (a) over site A, (b) over site B, where
the dust wall was documented (time in UTC). The peak intensity is at 1230–1330, where over site
B the TKE is stronger than over site A
estimation of the observed dust wall, and might explain the vertical dimension of
the dust front. A comparison with some ground meteorological observations showed
a significant disagreement; however, the simulated coastal upper air profiles had a
fair fit with the standard 12Z radiosonde, as shown in Fig. 68.3. The simulated wind
over site A was much weaker than the observed, yet its direction was similar to the
coastal one.
A further analysis based on available synoptic maps suggested that the model
failure to identify the dust front development may be attributed to the synoptic missinitiation of the deep low location and orientation. Local to mesoscale land-use
features could have locally intensified the dust load and turbulence, while incorrect
input values of these parameters may have caused a significant miscalculations by
the model, as was also discussed by Gasch et al. [3].
68.4 Summary
The dust event in this study had unique characteristics by means of size, intensity and
duration. The attempt to analyze the event by employing RAMS provided an insight
of possible dynamic features and dimensions of the event, such as the intensity of
the vertical turbulence, which might explain the vertical dimensions of the observed
dust front. Under the current configuration, although fair agreement of upper-air wind
429
0
500
1000
1500
2000
2500
0.0
0.5
1.0
1.5
2.0
Z [m]
TKE
(b)
1130
1230
1330
1430
0
500
1000
1500
2000
2500
0.0
0.5
1.0
1.5
2.0
Z [m]
TKE
(a)
Fig. 68.2 Simulated hourly TKE along the event duration (a) over site A, (b) over site B, where
the dust wall was documented (time in UTC). The peak intensity is at 1230–1330, where over site
B the TKE is stronger than over site A
estimation of the observed dust wall, and might explain the vertical dimension of
the dust front. A comparison with some ground meteorological observations showed
a significant disagreement; however, the simulated coastal upper air profiles had a
fair fit with the standard 12Z radiosonde, as shown in Fig. 68.3. The simulated wind
over site A was much weaker than the observed, yet its direction was similar to the
coastal one.
A further analysis based on available synoptic maps suggested that the model
failure to identify the dust front development may be attributed to the synoptic missinitiation of the deep low location and orientation. Local to mesoscale land-use
features could have locally intensified the dust load and turbulence, while incorrect
input values of these parameters may have caused a significant miscalculations by
the model, as was also discussed by Gasch et al. [3].
68.4 Summary
The dust event in this study had unique characteristics by means of size, intensity and
duration. The attempt to analyze the event by employing RAMS provided an insight
of possible dynamic features and dimensions of the event, such as the intensity of
the vertical turbulence, which might explain the vertical dimensions of the observed
dust front. Under the current configuration, although fair agreement of upper-air wind