

428
N. Haikin and P. Alpert
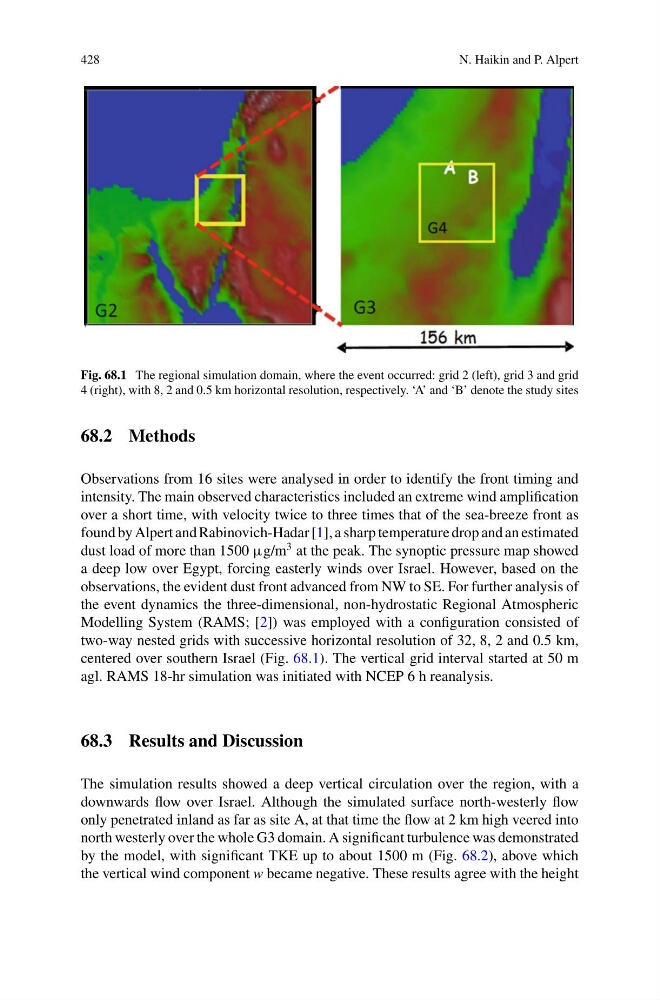
Fig. 68.1 The regional simulation domain, where the event occurred: grid 2 (left), grid 3 and grid
4 (right), with 8, 2 and 0.5 km horizontal resolution, respectively. ‘A’ and ‘B’ denote the study sites
68.2 Methods
Observations from 16 sites were analysed in order to identify the front timing and
intensity. The main observed characteristics included an extreme wind amplification
over a short time, with velocity twice to three times that of the sea-breeze front as
found by Alpert and Rabinovich-Hadar [1], a sharp temperature drop and an estimated
dust load of more than 1500 µg/m
3 at the peak. The synoptic pressure map showed
a deep low over Egypt, forcing easterly winds over Israel. However, based on the
observations, the evident dust front advanced from NW to SE. For further analysis of
the event dynamics the three-dimensional, non-hydrostatic Regional Atmospheric
Modelling System (RAMS; [2]) was employed with a configuration consisted of
two-way nested grids with successive horizontal resolution of 32, 8, 2 and 0.5 km,
centered over southern Israel (Fig. 68.1). The vertical grid interval started at 50 m
agl. RAMS 18-hr simulation was initiated with NCEP 6 h reanalysis.
68.3 Results and Discussion
The simulation results showed a deep vertical circulation over the region, with a
downwards flow over Israel. Although the simulated surface north-westerly flow
only penetrated inland as far as site A, at that time the flow at 2 km high veered into
north westerly over the whole G3 domain. A significant turbulence was demonstrated
by the model, with significant TKE up to about 1500 m (Fig. 68.2), above which
the vertical wind component w became negative. These results agree with the height
N. Haikin and P. Alpert
Fig. 68.1 The regional simulation domain, where the event occurred: grid 2 (left), grid 3 and grid
4 (right), with 8, 2 and 0.5 km horizontal resolution, respectively. ‘A’ and ‘B’ denote the study sites
68.2 Methods
Observations from 16 sites were analysed in order to identify the front timing and
intensity. The main observed characteristics included an extreme wind amplification
over a short time, with velocity twice to three times that of the sea-breeze front as
found by Alpert and Rabinovich-Hadar [1], a sharp temperature drop and an estimated
dust load of more than 1500 µg/m
3 at the peak. The synoptic pressure map showed
a deep low over Egypt, forcing easterly winds over Israel. However, based on the
observations, the evident dust front advanced from NW to SE. For further analysis of
the event dynamics the three-dimensional, non-hydrostatic Regional Atmospheric
Modelling System (RAMS; [2]) was employed with a configuration consisted of
two-way nested grids with successive horizontal resolution of 32, 8, 2 and 0.5 km,
centered over southern Israel (Fig. 68.1). The vertical grid interval started at 50 m
agl. RAMS 18-hr simulation was initiated with NCEP 6 h reanalysis.
68.3 Results and Discussion
The simulation results showed a deep vertical circulation over the region, with a
downwards flow over Israel. Although the simulated surface north-westerly flow
only penetrated inland as far as site A, at that time the flow at 2 km high veered into
north westerly over the whole G3 domain. A significant turbulence was demonstrated
by the model, with significant TKE up to about 1500 m (Fig. 68.2), above which
the vertical wind component w became negative. These results agree with the height