

63 On the Importance of Organic Mass for Global Cloud …
397
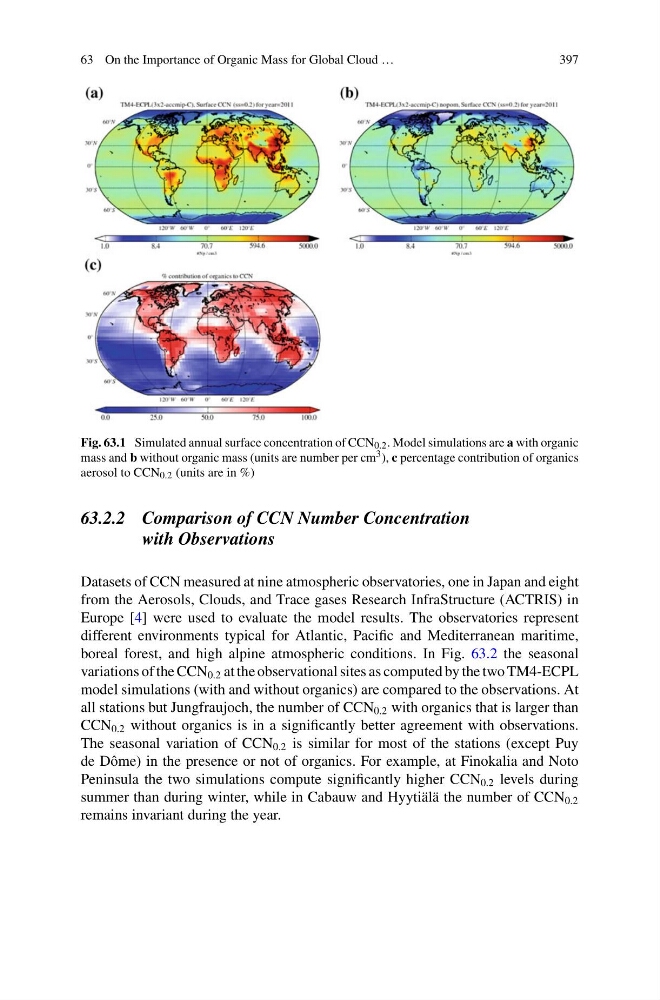
Fig. 63.1 Simulated annual surface concentration of CCN 0.2 . Model simulations are a with organic
mass and b without organic mass (units are number per cm 3 ), c percentage contribution of organics
aerosol to CCN 0.2 (units are in %)
63.2.2 Comparison of CCN Number Concentration
with Observations
Datasets of CCN measured at nine atmospheric observatories, one in Japan and eight
from the Aerosols, Clouds, and Trace gases Research InfraStructure (ACTRIS) in
Europe [4] were used to evaluate the model results. The observatories represent
different environments typical for Atlantic, Pacific and Mediterranean maritime,
boreal forest, and high alpine atmospheric conditions. In Fig. 63.2 the seasonal
variations of the CCN 0.2 at the observational sites as computed by the two TM4-ECPL
model simulations (with and without organics) are compared to the observations. At
all stations but Jungfraujoch, the number of CCN 0.2 with organics that is larger than
CCN 0.2 without organics is in a significantly better agreement with observations.
The seasonal variation of CCN 0.2 is similar for most of the stations (except Puy
de Dôme) in the presence or not of organics. For example, at Finokalia and Noto
Peninsula the two simulations compute significantly higher CCN 0.2 levels during
summer than during winter, while in Cabauw and Hyytiälä the number of CCN 0.2
remains invariant during the year.
397
Fig. 63.1 Simulated annual surface concentration of CCN 0.2 . Model simulations are a with organic
mass and b without organic mass (units are number per cm 3 ), c percentage contribution of organics
aerosol to CCN 0.2 (units are in %)
63.2.2 Comparison of CCN Number Concentration
with Observations
Datasets of CCN measured at nine atmospheric observatories, one in Japan and eight
from the Aerosols, Clouds, and Trace gases Research InfraStructure (ACTRIS) in
Europe [4] were used to evaluate the model results. The observatories represent
different environments typical for Atlantic, Pacific and Mediterranean maritime,
boreal forest, and high alpine atmospheric conditions. In Fig. 63.2 the seasonal
variations of the CCN 0.2 at the observational sites as computed by the two TM4-ECPL
model simulations (with and without organics) are compared to the observations. At
all stations but Jungfraujoch, the number of CCN 0.2 with organics that is larger than
CCN 0.2 without organics is in a significantly better agreement with observations.
The seasonal variation of CCN 0.2 is similar for most of the stations (except Puy
de Dôme) in the presence or not of organics. For example, at Finokalia and Noto
Peninsula the two simulations compute significantly higher CCN 0.2 levels during
summer than during winter, while in Cabauw and Hyytiälä the number of CCN 0.2
remains invariant during the year.