

58 Model of Arrival Time for Gas Clouds in Urban Canopy
367
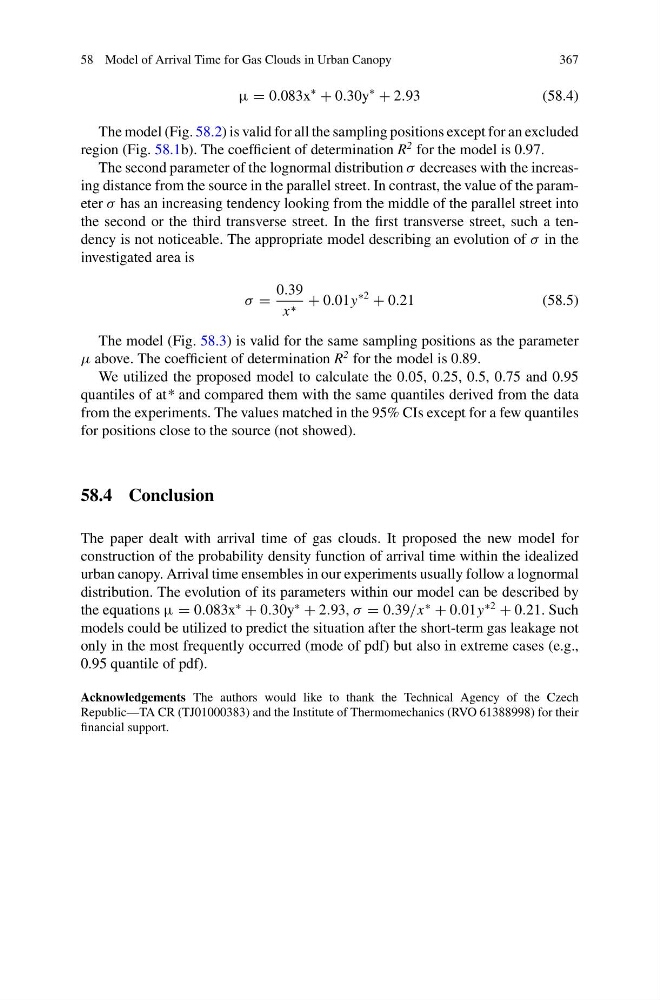
µ = 0.083x
∗
+ 0.30y
∗
+ 2.93
(58.4)
The model (Fig. 58.2) is valid for all the sampling positions except for an excluded
region (Fig. 58.1b). The coefficient of determination R
2 for the model is 0.97.
The second parameter of the lognormal distribution σ decreases with the increasing distance from the source in the parallel street. In contrast, the value of the parameter σ has an increasing tendency looking from the middle of the parallel street into
the second or the third transverse street. In the first transverse street, such a tendency is not noticeable. The appropriate model describing an evolution of σ in the
investigated area is
σ =
0.39
x ∗ + 0.01y
∗2
+ 0.21
(58.5)
The model (Fig. 58.3) is valid for the same sampling positions as the parameter
μ above. The coefficient of determination R
2 for the model is 0.89.
We utilized the proposed model to calculate the 0.05, 0.25, 0.5, 0.75 and 0.95
quantiles of at* and compared them with the same quantiles derived from the data
from the experiments. The values matched in the 95% CIs except for a few quantiles
for positions close to the source (not showed).
58.4 Conclusion
The paper dealt with arrival time of gas clouds. It proposed the new model for
construction of the probability density function of arrival time within the idealized
urban canopy. Arrival time ensembles in our experiments usually follow a lognormal
distribution. The evolution of its parameters within our model can be described by
the equations µ = 0.083x
∗
+ 0.30y
∗
+ 2.93, σ = 0.39/x
∗
+ 0.01y
∗2
+ 0.21. Such
models could be utilized to predict the situation after the short-term gas leakage not
only in the most frequently occurred (mode of pdf) but also in extreme cases (e.g.,
0.95 quantile of pdf).
Acknowledgements The authors would like to thank the Technical Agency of the Czech
Republic—TA CR (TJ01000383) and the Institute of Thermomechanics (RVO 61388998) for their
financial support.
367
µ = 0.083x
∗
+ 0.30y
∗
+ 2.93
(58.4)
The model (Fig. 58.2) is valid for all the sampling positions except for an excluded
region (Fig. 58.1b). The coefficient of determination R
2 for the model is 0.97.
The second parameter of the lognormal distribution σ decreases with the increasing distance from the source in the parallel street. In contrast, the value of the parameter σ has an increasing tendency looking from the middle of the parallel street into
the second or the third transverse street. In the first transverse street, such a tendency is not noticeable. The appropriate model describing an evolution of σ in the
investigated area is
σ =
0.39
x ∗ + 0.01y
∗2
+ 0.21
(58.5)
The model (Fig. 58.3) is valid for the same sampling positions as the parameter
μ above. The coefficient of determination R
2 for the model is 0.89.
We utilized the proposed model to calculate the 0.05, 0.25, 0.5, 0.75 and 0.95
quantiles of at* and compared them with the same quantiles derived from the data
from the experiments. The values matched in the 95% CIs except for a few quantiles
for positions close to the source (not showed).
58.4 Conclusion
The paper dealt with arrival time of gas clouds. It proposed the new model for
construction of the probability density function of arrival time within the idealized
urban canopy. Arrival time ensembles in our experiments usually follow a lognormal
distribution. The evolution of its parameters within our model can be described by
the equations µ = 0.083x
∗
+ 0.30y
∗
+ 2.93, σ = 0.39/x
∗
+ 0.01y
∗2
+ 0.21. Such
models could be utilized to predict the situation after the short-term gas leakage not
only in the most frequently occurred (mode of pdf) but also in extreme cases (e.g.,
0.95 quantile of pdf).
Acknowledgements The authors would like to thank the Technical Agency of the Czech
Republic—TA CR (TJ01000383) and the Institute of Thermomechanics (RVO 61388998) for their
financial support.