

366
H. Chaloupecká et al.
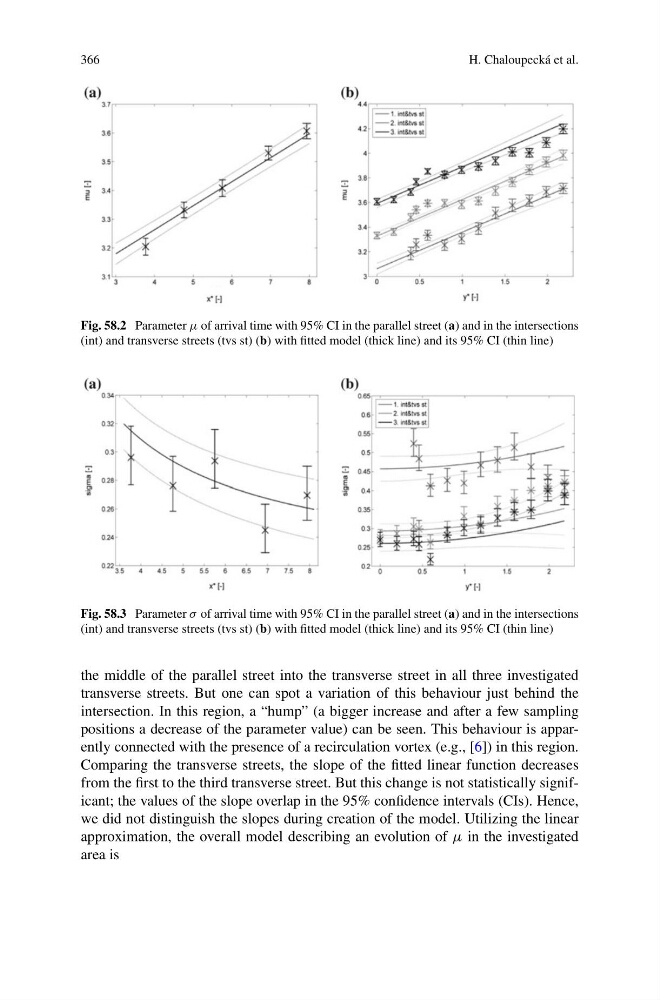
Fig. 58.2 Parameter μ of arrival time with 95% CI in the parallel street (a) and in the intersections
(int) and transverse streets (tvs st) (b) with fitted model (thick line) and its 95% CI (thin line)
Fig. 58.3 Parameter σ of arrival time with 95% CI in the parallel street (a) and in the intersections
(int) and transverse streets (tvs st) (b) with fitted model (thick line) and its 95% CI (thin line)
the middle of the parallel street into the transverse street in all three investigated
transverse streets. But one can spot a variation of this behaviour just behind the
intersection. In this region, a “hump” (a bigger increase and after a few sampling
positions a decrease of the parameter value) can be seen. This behaviour is apparently connected with the presence of a recirculation vortex (e.g., [6]) in this region.
Comparing the transverse streets, the slope of the fitted linear function decreases
from the first to the third transverse street. But this change is not statistically significant; the values of the slope overlap in the 95% confidence intervals (CIs). Hence,
we did not distinguish the slopes during creation of the model. Utilizing the linear
approximation, the overall model describing an evolution of μ in the investigated
area is
H. Chaloupecká et al.
Fig. 58.2 Parameter μ of arrival time with 95% CI in the parallel street (a) and in the intersections
(int) and transverse streets (tvs st) (b) with fitted model (thick line) and its 95% CI (thin line)
Fig. 58.3 Parameter σ of arrival time with 95% CI in the parallel street (a) and in the intersections
(int) and transverse streets (tvs st) (b) with fitted model (thick line) and its 95% CI (thin line)
the middle of the parallel street into the transverse street in all three investigated
transverse streets. But one can spot a variation of this behaviour just behind the
intersection. In this region, a “hump” (a bigger increase and after a few sampling
positions a decrease of the parameter value) can be seen. This behaviour is apparently connected with the presence of a recirculation vortex (e.g., [6]) in this region.
Comparing the transverse streets, the slope of the fitted linear function decreases
from the first to the third transverse street. But this change is not statistically significant; the values of the slope overlap in the 95% confidence intervals (CIs). Hence,
we did not distinguish the slopes during creation of the model. Utilizing the linear
approximation, the overall model describing an evolution of μ in the investigated
area is