

52 Is a Model’s Scatter Really “Very Small” …
333
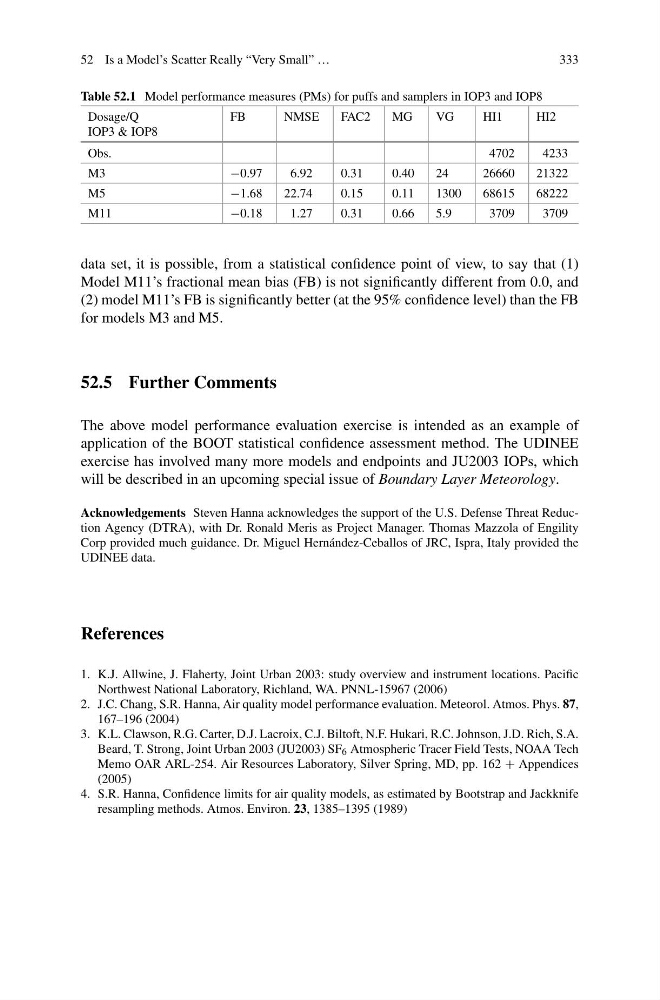
Table 52.1 Model performance measures (PMs) for puffs and samplers in IOP3 and IOP8
Dosage/Q
IOP3 & IOP8
FB
NMSE
FAC2
MG
VG
HI1
HI2
Obs.
4702
4233
M3
−0.97
6.92
0.31
0.40
24
26660
21322
M5
−1.68
22.74
0.15
0.11
1300
68615
68222
M11
−0.18
1.27
0.31
0.66
5.9
3709
3709
data set, it is possible, from a statistical confidence point of view, to say that (1)
Model M11’s fractional mean bias (FB) is not significantly different from 0.0, and
(2) model M11’s FB is significantly better (at the 95% confidence level) than the FB
for models M3 and M5.
52.5 Further Comments
The above model performance evaluation exercise is intended as an example of
application of the BOOT statistical confidence assessment method. The UDINEE
exercise has involved many more models and endpoints and JU2003 IOPs, which
will be described in an upcoming special issue of Boundary Layer Meteorology.
Acknowledgements Steven Hanna acknowledges the support of the U.S. Defense Threat Reduction Agency (DTRA), with Dr. Ronald Meris as Project Manager. Thomas Mazzola of Engility
Corp provided much guidance. Dr. Miguel Hernández-Ceballos of JRC, Ispra, Italy provided the
UDINEE data.
References
1. K.J. Allwine, J. Flaherty, Joint Urban 2003: study overview and instrument locations. Pacific
Northwest National Laboratory, Richland, WA. PNNL-15967 (2006)
2. J.C. Chang, S.R. Hanna, Air quality model performance evaluation. Meteorol. Atmos. Phys. 87,
167–196 (2004)
3. K.L. Clawson, R.G. Carter, D.J. Lacroix, C.J. Biltoft, N.F. Hukari, R.C. Johnson, J.D. Rich, S.A.
Beard, T. Strong, Joint Urban 2003 (JU2003) SF 6 Atmospheric Tracer Field Tests, NOAA Tech
Memo OAR ARL-254. Air Resources Laboratory, Silver Spring, MD, pp. 162 + Appendices
(2005)
4. S.R. Hanna, Confidence limits for air quality models, as estimated by Bootstrap and Jackknife
resampling methods. Atmos. Environ. 23, 1385–1395 (1989)
333
Table 52.1 Model performance measures (PMs) for puffs and samplers in IOP3 and IOP8
Dosage/Q
IOP3 & IOP8
FB
NMSE
FAC2
MG
VG
HI1
HI2
Obs.
4702
4233
M3
−0.97
6.92
0.31
0.40
24
26660
21322
M5
−1.68
22.74
0.15
0.11
1300
68615
68222
M11
−0.18
1.27
0.31
0.66
5.9
3709
3709
data set, it is possible, from a statistical confidence point of view, to say that (1)
Model M11’s fractional mean bias (FB) is not significantly different from 0.0, and
(2) model M11’s FB is significantly better (at the 95% confidence level) than the FB
for models M3 and M5.
52.5 Further Comments
The above model performance evaluation exercise is intended as an example of
application of the BOOT statistical confidence assessment method. The UDINEE
exercise has involved many more models and endpoints and JU2003 IOPs, which
will be described in an upcoming special issue of Boundary Layer Meteorology.
Acknowledgements Steven Hanna acknowledges the support of the U.S. Defense Threat Reduction Agency (DTRA), with Dr. Ronald Meris as Project Manager. Thomas Mazzola of Engility
Corp provided much guidance. Dr. Miguel Hernández-Ceballos of JRC, Ispra, Italy provided the
UDINEE data.
References
1. K.J. Allwine, J. Flaherty, Joint Urban 2003: study overview and instrument locations. Pacific
Northwest National Laboratory, Richland, WA. PNNL-15967 (2006)
2. J.C. Chang, S.R. Hanna, Air quality model performance evaluation. Meteorol. Atmos. Phys. 87,
167–196 (2004)
3. K.L. Clawson, R.G. Carter, D.J. Lacroix, C.J. Biltoft, N.F. Hukari, R.C. Johnson, J.D. Rich, S.A.
Beard, T. Strong, Joint Urban 2003 (JU2003) SF 6 Atmospheric Tracer Field Tests, NOAA Tech
Memo OAR ARL-254. Air Resources Laboratory, Silver Spring, MD, pp. 162 + Appendices
(2005)
4. S.R. Hanna, Confidence limits for air quality models, as estimated by Bootstrap and Jackknife
resampling methods. Atmos. Environ. 23, 1385–1395 (1989)