

332
S. Hanna and J. Chang
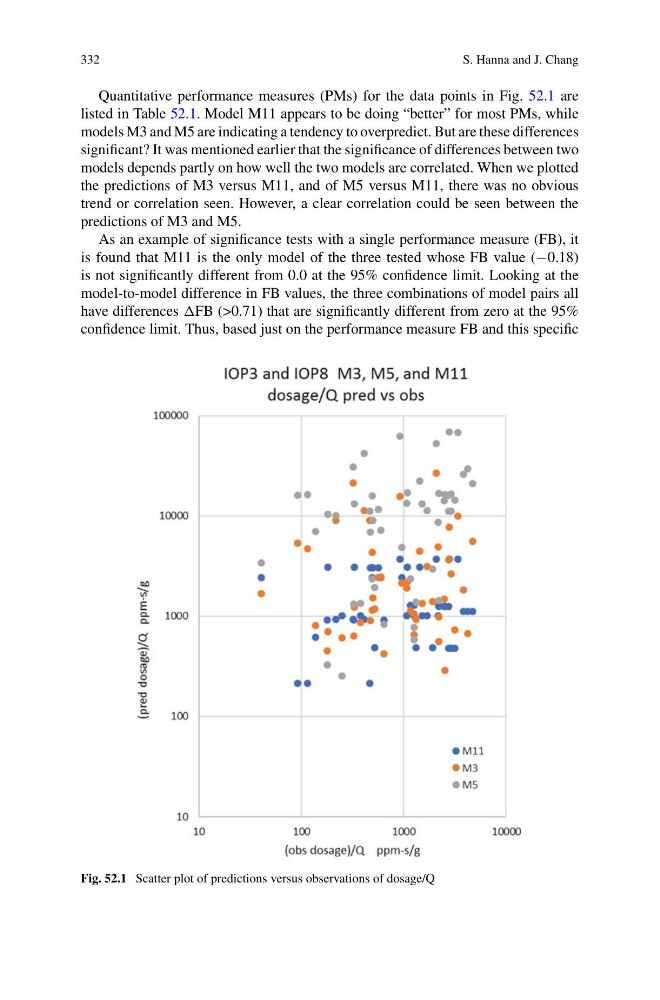
Quantitative performance measures (PMs) for the data points in Fig. 52.1 are
listed in Table 52.1. Model M11 appears to be doing “better” for most PMs, while
models M3 and M5 are indicating a tendency to overpredict. But are these differences
significant? It was mentioned earlier that the significance of differences between two
models depends partly on how well the two models are correlated. When we plotted
the predictions of M3 versus M11, and of M5 versus M11, there was no obvious
trend or correlation seen. However, a clear correlation could be seen between the
predictions of M3 and M5.
As an example of significance tests with a single performance measure (FB), it
is found that M11 is the only model of the three tested whose FB value (−0.18)
is not significantly different from 0.0 at the 95% confidence limit. Looking at the
model-to-model difference in FB values, the three combinations of model pairs all
have differences FB (>0.71) that are significantly different from zero at the 95%
confidence limit. Thus, based just on the performance measure FB and this specific
Fig. 52.1 Scatter plot of predictions versus observations of dosage/Q
S. Hanna and J. Chang
Quantitative performance measures (PMs) for the data points in Fig. 52.1 are
listed in Table 52.1. Model M11 appears to be doing “better” for most PMs, while
models M3 and M5 are indicating a tendency to overpredict. But are these differences
significant? It was mentioned earlier that the significance of differences between two
models depends partly on how well the two models are correlated. When we plotted
the predictions of M3 versus M11, and of M5 versus M11, there was no obvious
trend or correlation seen. However, a clear correlation could be seen between the
predictions of M3 and M5.
As an example of significance tests with a single performance measure (FB), it
is found that M11 is the only model of the three tested whose FB value (−0.18)
is not significantly different from 0.0 at the 95% confidence limit. Looking at the
model-to-model difference in FB values, the three combinations of model pairs all
have differences FB (>0.71) that are significantly different from zero at the 95%
confidence limit. Thus, based just on the performance measure FB and this specific
Fig. 52.1 Scatter plot of predictions versus observations of dosage/Q