

51 Lightning NO X Distribution and Its Impact on Ozone …
325
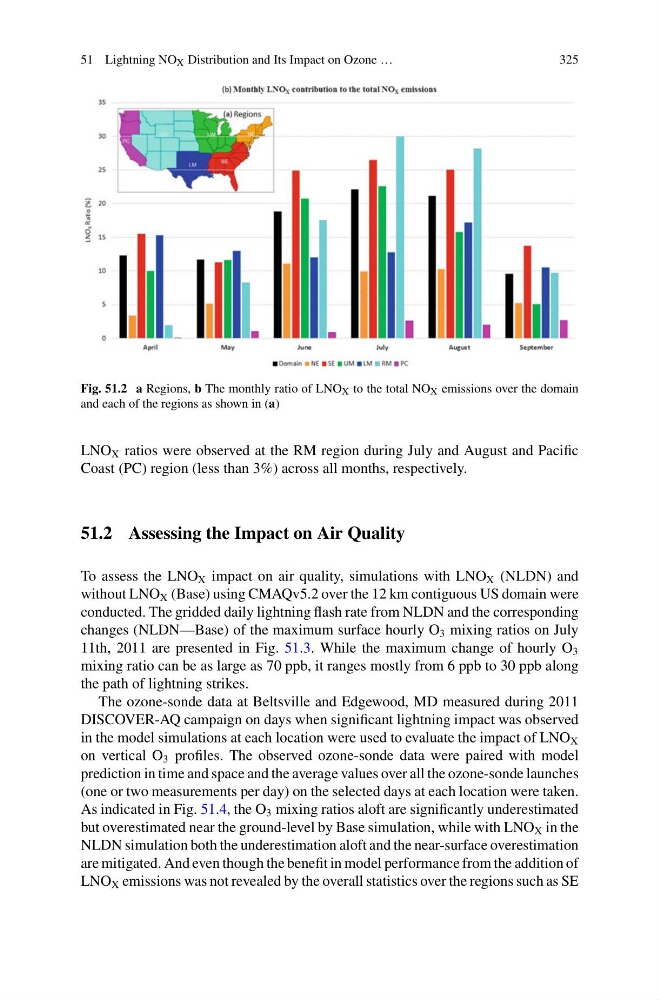
Fig. 51.2 a Regions, b The monthly ratio of LNO X to the total NO X emissions over the domain
and each of the regions as shown in (a)
LNO X ratios were observed at the RM region during July and August and Pacific
Coast (PC) region (less than 3%) across all months, respectively.
51.2 Assessing the Impact on Air Quality
To assess the LNO X impact on air quality, simulations with LNO X (NLDN) and
without LNO X (Base) using CMAQv5.2 over the 12 km contiguous US domain were
conducted. The gridded daily lightning flash rate from NLDN and the corresponding
changes (NLDN—Base) of the maximum surface hourly O 3 mixing ratios on July
11th, 2011 are presented in Fig. 51.3. While the maximum change of hourly O 3
mixing ratio can be as large as 70 ppb, it ranges mostly from 6 ppb to 30 ppb along
the path of lightning strikes.
The ozone-sonde data at Beltsville and Edgewood, MD measured during 2011
DISCOVER-AQ campaign on days when significant lightning impact was observed
in the model simulations at each location were used to evaluate the impact of LNO X
on vertical O 3 profiles. The observed ozone-sonde data were paired with model
prediction in time and space and the average values over all the ozone-sonde launches
(one or two measurements per day) on the selected days at each location were taken.
As indicated in Fig. 51.4, the O 3 mixing ratios aloft are significantly underestimated
but overestimated near the ground-level by Base simulation, while with LNO X in the
NLDN simulation both the underestimation aloft and the near-surface overestimation
are mitigated. And even though the benefit in model performance from the addition of
LNO X emissions was not revealed by the overall statistics over the regions such as SE
325
Fig. 51.2 a Regions, b The monthly ratio of LNO X to the total NO X emissions over the domain
and each of the regions as shown in (a)
LNO X ratios were observed at the RM region during July and August and Pacific
Coast (PC) region (less than 3%) across all months, respectively.
51.2 Assessing the Impact on Air Quality
To assess the LNO X impact on air quality, simulations with LNO X (NLDN) and
without LNO X (Base) using CMAQv5.2 over the 12 km contiguous US domain were
conducted. The gridded daily lightning flash rate from NLDN and the corresponding
changes (NLDN—Base) of the maximum surface hourly O 3 mixing ratios on July
11th, 2011 are presented in Fig. 51.3. While the maximum change of hourly O 3
mixing ratio can be as large as 70 ppb, it ranges mostly from 6 ppb to 30 ppb along
the path of lightning strikes.
The ozone-sonde data at Beltsville and Edgewood, MD measured during 2011
DISCOVER-AQ campaign on days when significant lightning impact was observed
in the model simulations at each location were used to evaluate the impact of LNO X
on vertical O 3 profiles. The observed ozone-sonde data were paired with model
prediction in time and space and the average values over all the ozone-sonde launches
(one or two measurements per day) on the selected days at each location were taken.
As indicated in Fig. 51.4, the O 3 mixing ratios aloft are significantly underestimated
but overestimated near the ground-level by Base simulation, while with LNO X in the
NLDN simulation both the underestimation aloft and the near-surface overestimation
are mitigated. And even though the benefit in model performance from the addition of
LNO X emissions was not revealed by the overall statistics over the regions such as SE