

324
D. Kang et al.
Conditions from Column and Vertically Resolved Observations Relevant to Air Quality (DISCOVER-AQ; https://www-air.larc.nasa.gov/missions/discover-aq/discoveraq.html) 2011 campaign.
51.1 NO X Emissions and the Relative Contributions
of LNO X
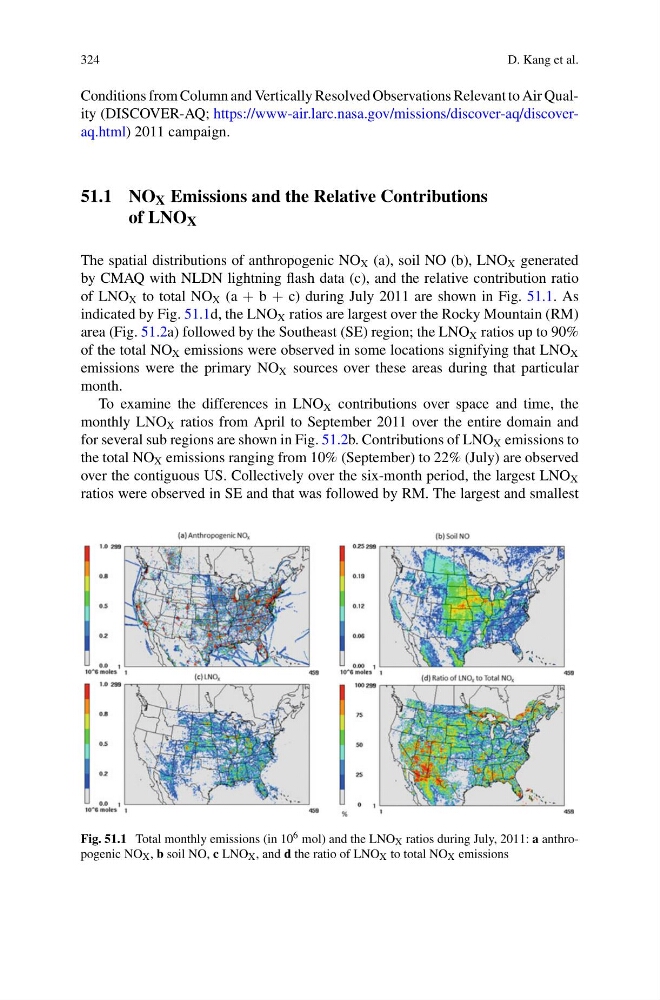
The spatial distributions of anthropogenic NO X (a), soil NO (b), LNO X generated
by CMAQ with NLDN lightning flash data (c), and the relative contribution ratio
of LNO X to total NO X (a + b + c) during July 2011 are shown in Fig. 51.1. As
indicated by Fig. 51.1d, the LNO X ratios are largest over the Rocky Mountain (RM)
area (Fig. 51.2a) followed by the Southeast (SE) region; the LNO X ratios up to 90%
of the total NO X emissions were observed in some locations signifying that LNO X
emissions were the primary NO X sources over these areas during that particular
month.
To examine the differences in LNO X contributions over space and time, the
monthly LNO X ratios from April to September 2011 over the entire domain and
for several sub regions are shown in Fig. 51.2b. Contributions of LNO X emissions to
the total NO X emissions ranging from 10% (September) to 22% (July) are observed
over the contiguous US. Collectively over the six-month period, the largest LNO X
ratios were observed in SE and that was followed by RM. The largest and smallest
Fig. 51.1 Total monthly emissions (in 10 6 mol) and the LNO X ratios during July, 2011: a anthropogenic NO X , b soil NO, c LNO X , and d the ratio of LNO X to total NO X emissions
D. Kang et al.
Conditions from Column and Vertically Resolved Observations Relevant to Air Quality (DISCOVER-AQ; https://www-air.larc.nasa.gov/missions/discover-aq/discoveraq.html) 2011 campaign.
51.1 NO X Emissions and the Relative Contributions
of LNO X
The spatial distributions of anthropogenic NO X (a), soil NO (b), LNO X generated
by CMAQ with NLDN lightning flash data (c), and the relative contribution ratio
of LNO X to total NO X (a + b + c) during July 2011 are shown in Fig. 51.1. As
indicated by Fig. 51.1d, the LNO X ratios are largest over the Rocky Mountain (RM)
area (Fig. 51.2a) followed by the Southeast (SE) region; the LNO X ratios up to 90%
of the total NO X emissions were observed in some locations signifying that LNO X
emissions were the primary NO X sources over these areas during that particular
month.
To examine the differences in LNO X contributions over space and time, the
monthly LNO X ratios from April to September 2011 over the entire domain and
for several sub regions are shown in Fig. 51.2b. Contributions of LNO X emissions to
the total NO X emissions ranging from 10% (September) to 22% (July) are observed
over the contiguous US. Collectively over the six-month period, the largest LNO X
ratios were observed in SE and that was followed by RM. The largest and smallest
Fig. 51.1 Total monthly emissions (in 10 6 mol) and the LNO X ratios during July, 2011: a anthropogenic NO X , b soil NO, c LNO X , and d the ratio of LNO X to total NO X emissions