

49 Multi Model Study on the Impact of Emissions on CTMs
313
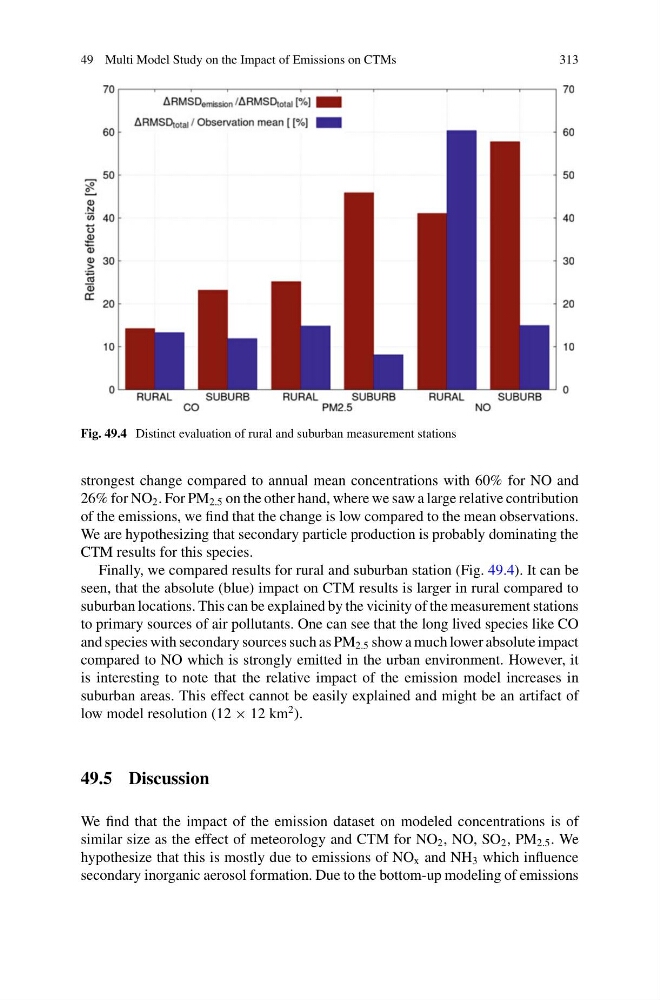
Fig. 49.4 Distinct evaluation of rural and suburban measurement stations
strongest change compared to annual mean concentrations with 60% for NO and
26% for NO 2 . For PM 2.5 on the other hand, where we saw a large relative contribution
of the emissions, we find that the change is low compared to the mean observations.
We are hypothesizing that secondary particle production is probably dominating the
CTM results for this species.
Finally, we compared results for rural and suburban station (Fig. 49.4). It can be
seen, that the absolute (blue) impact on CTM results is larger in rural compared to
suburban locations. This can be explained by the vicinity of the measurement stations
to primary sources of air pollutants. One can see that the long lived species like CO
and species with secondary sources such as PM 2.5 show a much lower absolute impact
compared to NO which is strongly emitted in the urban environment. However, it
is interesting to note that the relative impact of the emission model increases in
suburban areas. This effect cannot be easily explained and might be an artifact of
low model resolution (12 × 12 km
2 ).
49.5 Discussion
We find that the impact of the emission dataset on modeled concentrations is of
similar size as the effect of meteorology and CTM for NO 2 , NO, SO 2 , PM 2.5 . We
hypothesize that this is mostly due to emissions of NO x and NH 3 which influence
secondary inorganic aerosol formation. Due to the bottom-up modeling of emissions
313
Fig. 49.4 Distinct evaluation of rural and suburban measurement stations
strongest change compared to annual mean concentrations with 60% for NO and
26% for NO 2 . For PM 2.5 on the other hand, where we saw a large relative contribution
of the emissions, we find that the change is low compared to the mean observations.
We are hypothesizing that secondary particle production is probably dominating the
CTM results for this species.
Finally, we compared results for rural and suburban station (Fig. 49.4). It can be
seen, that the absolute (blue) impact on CTM results is larger in rural compared to
suburban locations. This can be explained by the vicinity of the measurement stations
to primary sources of air pollutants. One can see that the long lived species like CO
and species with secondary sources such as PM 2.5 show a much lower absolute impact
compared to NO which is strongly emitted in the urban environment. However, it
is interesting to note that the relative impact of the emission model increases in
suburban areas. This effect cannot be easily explained and might be an artifact of
low model resolution (12 × 12 km
2 ).
49.5 Discussion
We find that the impact of the emission dataset on modeled concentrations is of
similar size as the effect of meteorology and CTM for NO 2 , NO, SO 2 , PM 2.5 . We
hypothesize that this is mostly due to emissions of NO x and NH 3 which influence
secondary inorganic aerosol formation. Due to the bottom-up modeling of emissions