

302
J. Soares et al.
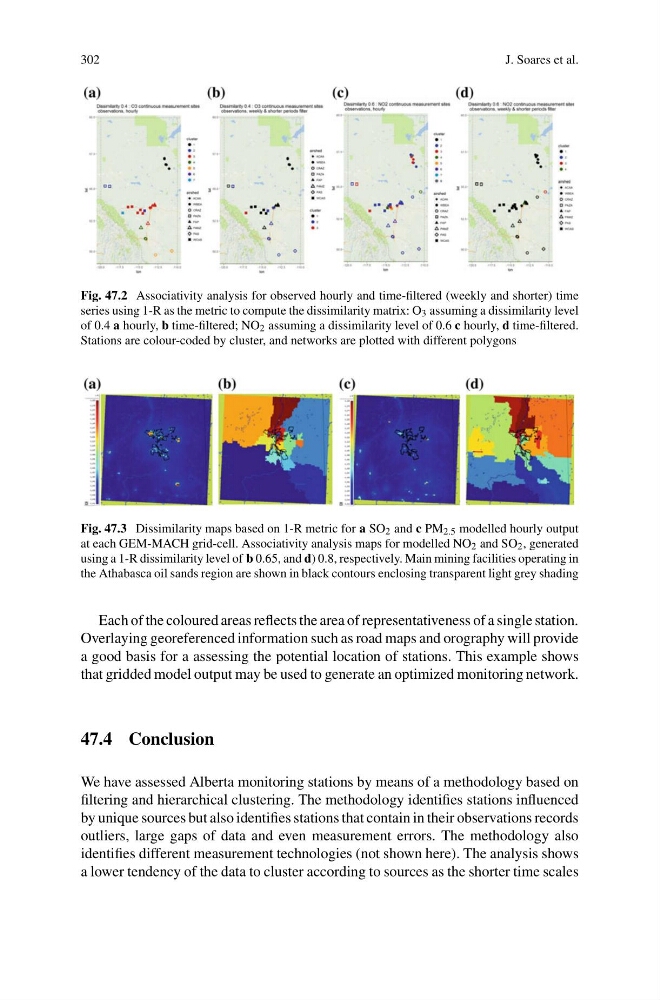
Fig. 47.2 Associativity analysis for observed hourly and time-filtered (weekly and shorter) time
series using 1-R as the metric to compute the dissimilarity matrix: O 3 assuming a dissimilarity level
of 0.4 a hourly, b time-filtered; NO 2 assuming a dissimilarity level of 0.6 c hourly, d time-filtered.
Stations are colour-coded by cluster, and networks are plotted with different polygons
Fig. 47.3 Dissimilarity maps based on 1-R metric for a SO 2 and c PM 2.5 modelled hourly output
at each GEM-MACH grid-cell. Associativity analysis maps for modelled NO 2 and SO 2 , generated
using a 1-R dissimilarity level of b 0.65, and d) 0.8, respectively. Main mining facilities operating in
the Athabasca oil sands region are shown in black contours enclosing transparent light grey shading
Each of the coloured areas reflects the area of representativeness of a single station.
Overlaying georeferenced information such as road maps and orography will provide
a good basis for a assessing the potential location of stations. This example shows
that gridded model output may be used to generate an optimized monitoring network.
47.4 Conclusion
We have assessed Alberta monitoring stations by means of a methodology based on
filtering and hierarchical clustering. The methodology identifies stations influenced
by unique sources but also identifies stations that contain in their observations records
outliers, large gaps of data and even measurement errors. The methodology also
identifies different measurement technologies (not shown here). The analysis shows
a lower tendency of the data to cluster according to sources as the shorter time scales
J. Soares et al.
Fig. 47.2 Associativity analysis for observed hourly and time-filtered (weekly and shorter) time
series using 1-R as the metric to compute the dissimilarity matrix: O 3 assuming a dissimilarity level
of 0.4 a hourly, b time-filtered; NO 2 assuming a dissimilarity level of 0.6 c hourly, d time-filtered.
Stations are colour-coded by cluster, and networks are plotted with different polygons
Fig. 47.3 Dissimilarity maps based on 1-R metric for a SO 2 and c PM 2.5 modelled hourly output
at each GEM-MACH grid-cell. Associativity analysis maps for modelled NO 2 and SO 2 , generated
using a 1-R dissimilarity level of b 0.65, and d) 0.8, respectively. Main mining facilities operating in
the Athabasca oil sands region are shown in black contours enclosing transparent light grey shading
Each of the coloured areas reflects the area of representativeness of a single station.
Overlaying georeferenced information such as road maps and orography will provide
a good basis for a assessing the potential location of stations. This example shows
that gridded model output may be used to generate an optimized monitoring network.
47.4 Conclusion
We have assessed Alberta monitoring stations by means of a methodology based on
filtering and hierarchical clustering. The methodology identifies stations influenced
by unique sources but also identifies stations that contain in their observations records
outliers, large gaps of data and even measurement errors. The methodology also
identifies different measurement technologies (not shown here). The analysis shows
a lower tendency of the data to cluster according to sources as the shorter time scales