

47 Hierarchical Clustering for Optimizing Air Quality …
301
Alberta
Alberta
(a)
(b)
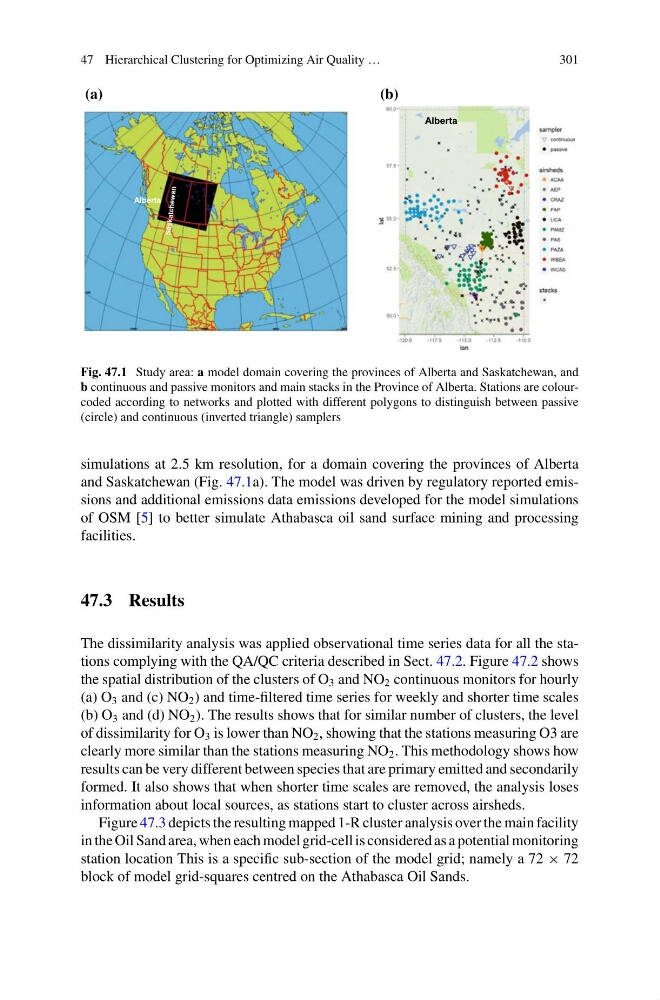
Fig. 47.1 Study area: a model domain covering the provinces of Alberta and Saskatchewan, and
b continuous and passive monitors and main stacks in the Province of Alberta. Stations are colourcoded according to networks and plotted with different polygons to distinguish between passive
(circle) and continuous (inverted triangle) samplers
simulations at 2.5 km resolution, for a domain covering the provinces of Alberta
and Saskatchewan (Fig. 47.1a). The model was driven by regulatory reported emissions and additional emissions data emissions developed for the model simulations
of OSM [5] to better simulate Athabasca oil sand surface mining and processing
facilities.
47.3 Results
The dissimilarity analysis was applied observational time series data for all the stations complying with the QA/QC criteria described in Sect. 47.2. Figure 47.2 shows
the spatial distribution of the clusters of O 3 and NO 2 continuous monitors for hourly
(a) O 3 and (c) NO 2 ) and time-filtered time series for weekly and shorter time scales
(b) O 3 and (d) NO 2 ). The results shows that for similar number of clusters, the level
of dissimilarity for O 3 is lower than NO 2 , showing that the stations measuring O3 are
clearly more similar than the stations measuring NO 2 . This methodology shows how
results can be very different between species that are primary emitted and secondarily
formed. It also shows that when shorter time scales are removed, the analysis loses
information about local sources, as stations start to cluster across airsheds.
Figure 47.3 depicts the resulting mapped 1-R cluster analysis over the main facility
in the Oil Sand area, when each model grid-cell is considered as a potential monitoring
station location This is a specific sub-section of the model grid; namely a 72 × 72
block of model grid-squares centred on the Athabasca Oil Sands.
301
Alberta
Alberta
(a)
(b)
Fig. 47.1 Study area: a model domain covering the provinces of Alberta and Saskatchewan, and
b continuous and passive monitors and main stacks in the Province of Alberta. Stations are colourcoded according to networks and plotted with different polygons to distinguish between passive
(circle) and continuous (inverted triangle) samplers
simulations at 2.5 km resolution, for a domain covering the provinces of Alberta
and Saskatchewan (Fig. 47.1a). The model was driven by regulatory reported emissions and additional emissions data emissions developed for the model simulations
of OSM [5] to better simulate Athabasca oil sand surface mining and processing
facilities.
47.3 Results
The dissimilarity analysis was applied observational time series data for all the stations complying with the QA/QC criteria described in Sect. 47.2. Figure 47.2 shows
the spatial distribution of the clusters of O 3 and NO 2 continuous monitors for hourly
(a) O 3 and (c) NO 2 ) and time-filtered time series for weekly and shorter time scales
(b) O 3 and (d) NO 2 ). The results shows that for similar number of clusters, the level
of dissimilarity for O 3 is lower than NO 2 , showing that the stations measuring O3 are
clearly more similar than the stations measuring NO 2 . This methodology shows how
results can be very different between species that are primary emitted and secondarily
formed. It also shows that when shorter time scales are removed, the analysis loses
information about local sources, as stations start to cluster across airsheds.
Figure 47.3 depicts the resulting mapped 1-R cluster analysis over the main facility
in the Oil Sand area, when each model grid-cell is considered as a potential monitoring
station location This is a specific sub-section of the model grid; namely a 72 × 72
block of model grid-squares centred on the Athabasca Oil Sands.