

288
V. Savic-Jovcic et al.
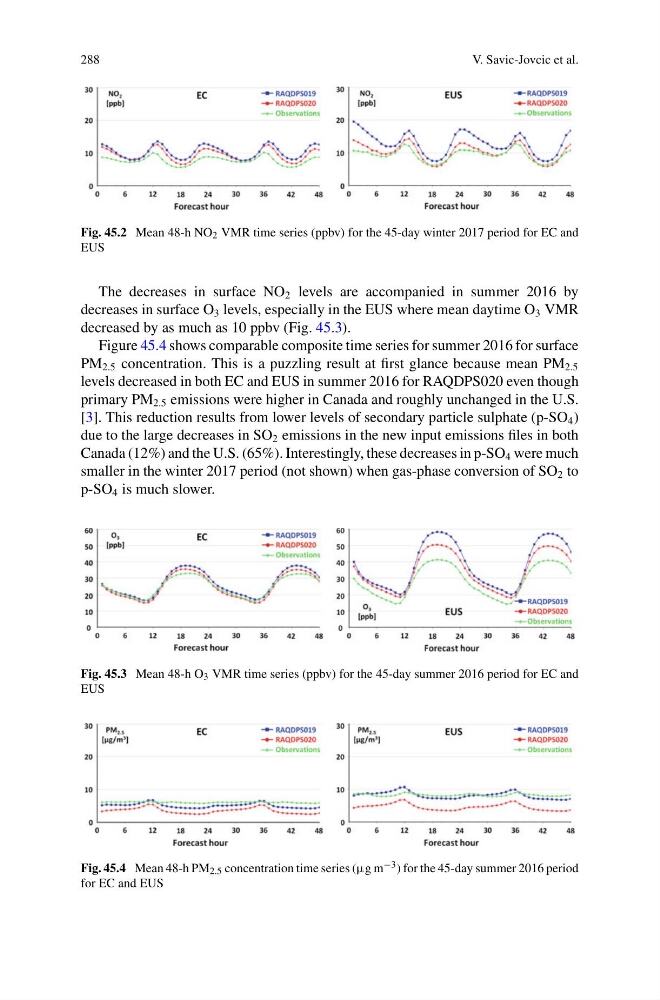
Fig. 45.2 Mean 48-h NO 2 VMR time series (ppbv) for the 45-day winter 2017 period for EC and
EUS
The decreases in surface NO 2 levels are accompanied in summer 2016 by
decreases in surface O 3 levels, especially in the EUS where mean daytime O 3 VMR
decreased by as much as 10 ppbv (Fig. 45.3).
Figure 45.4 shows comparable composite time series for summer 2016 for surface
PM 2.5 concentration. This is a puzzling result at first glance because mean PM 2.5
levels decreased in both EC and EUS in summer 2016 for RAQDPS020 even though
primary PM 2.5 emissions were higher in Canada and roughly unchanged in the U.S.
[3]. This reduction results from lower levels of secondary particle sulphate (p-SO 4 )
due to the large decreases in SO 2 emissions in the new input emissions files in both
Canada (12%) and the U.S. (65%). Interestingly, these decreases in p-SO 4 were much
smaller in the winter 2017 period (not shown) when gas-phase conversion of SO 2 to
p-SO 4 is much slower.
Fig. 45.3 Mean 48-h O 3 VMR time series (ppbv) for the 45-day summer 2016 period for EC and
EUS
Fig. 45.4 Mean 48-h PM 2.5 concentration time series (µg m −3 ) for the 45-day summer 2016 period
for EC and EUS
V. Savic-Jovcic et al.
Fig. 45.2 Mean 48-h NO 2 VMR time series (ppbv) for the 45-day winter 2017 period for EC and
EUS
The decreases in surface NO 2 levels are accompanied in summer 2016 by
decreases in surface O 3 levels, especially in the EUS where mean daytime O 3 VMR
decreased by as much as 10 ppbv (Fig. 45.3).
Figure 45.4 shows comparable composite time series for summer 2016 for surface
PM 2.5 concentration. This is a puzzling result at first glance because mean PM 2.5
levels decreased in both EC and EUS in summer 2016 for RAQDPS020 even though
primary PM 2.5 emissions were higher in Canada and roughly unchanged in the U.S.
[3]. This reduction results from lower levels of secondary particle sulphate (p-SO 4 )
due to the large decreases in SO 2 emissions in the new input emissions files in both
Canada (12%) and the U.S. (65%). Interestingly, these decreases in p-SO 4 were much
smaller in the winter 2017 period (not shown) when gas-phase conversion of SO 2 to
p-SO 4 is much slower.
Fig. 45.3 Mean 48-h O 3 VMR time series (ppbv) for the 45-day summer 2016 period for EC and
EUS
Fig. 45.4 Mean 48-h PM 2.5 concentration time series (µg m −3 ) for the 45-day summer 2016 period
for EC and EUS