

45 Overview of the 2018 Canadian Operational Regional Air Quality …
287
addition of particle ammonium and nitrate emissions. Many code changes were
also made to fix minor bugs and to make the code faster (modified inorganic
heterogeneous chemistry module, improved input of chemical LBCs, turning
off most chemistry in stratosphere), more robust (e.g., improved thread safety),
and cleaner (e.g., removal of unused variables).
(4) New input emissions files were generated from three more recent national emissions inventories: a 2013 Canadian inventory; a projected 2017 U.S. inventory;
and a 2008 Mexican inventory. Due to this change, SO 2 , NO x , and VOC emissions are lower in both Canada and the U.S. Details are given in Moran et al.
[3].
(5) Nineteen hourly surface dry deposition fields and eleven hourly wet deposition
fields were added to RAQDPS020 as routine output fields. The availability of
these output fields will allow seasonal and annual wet deposition fields to be
calculated at the end of each forecast year, and these fields can in turn be used
by the new ECCC ADAGIO tool (Atmospheric Deposition Analysis Generated
by optimal Interpolation from Observations; [6]) that is being developed for
objective analysis of dry, wet, and total deposition.
More details can be found in Moran and Pavlovic [4].
45.3 Impact of Recent Updates
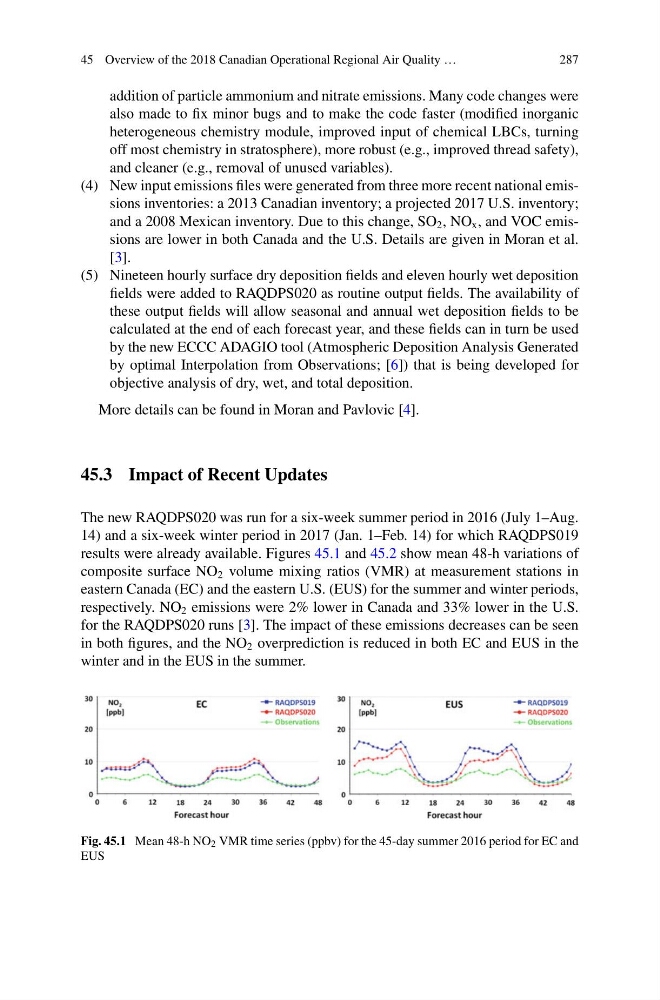
The new RAQDPS020 was run for a six-week summer period in 2016 (July 1–Aug.
14) and a six-week winter period in 2017 (Jan. 1–Feb. 14) for which RAQDPS019
results were already available. Figures 45.1 and 45.2 show mean 48-h variations of
composite surface NO 2 volume mixing ratios (VMR) at measurement stations in
eastern Canada (EC) and the eastern U.S. (EUS) for the summer and winter periods,
respectively. NO 2 emissions were 2% lower in Canada and 33% lower in the U.S.
for the RAQDPS020 runs [3]. The impact of these emissions decreases can be seen
in both figures, and the NO 2 overprediction is reduced in both EC and EUS in the
winter and in the EUS in the summer.
Fig. 45.1 Mean 48-h NO 2 VMR time series (ppbv) for the 45-day summer 2016 period for EC and
EUS
287
addition of particle ammonium and nitrate emissions. Many code changes were
also made to fix minor bugs and to make the code faster (modified inorganic
heterogeneous chemistry module, improved input of chemical LBCs, turning
off most chemistry in stratosphere), more robust (e.g., improved thread safety),
and cleaner (e.g., removal of unused variables).
(4) New input emissions files were generated from three more recent national emissions inventories: a 2013 Canadian inventory; a projected 2017 U.S. inventory;
and a 2008 Mexican inventory. Due to this change, SO 2 , NO x , and VOC emissions are lower in both Canada and the U.S. Details are given in Moran et al.
[3].
(5) Nineteen hourly surface dry deposition fields and eleven hourly wet deposition
fields were added to RAQDPS020 as routine output fields. The availability of
these output fields will allow seasonal and annual wet deposition fields to be
calculated at the end of each forecast year, and these fields can in turn be used
by the new ECCC ADAGIO tool (Atmospheric Deposition Analysis Generated
by optimal Interpolation from Observations; [6]) that is being developed for
objective analysis of dry, wet, and total deposition.
More details can be found in Moran and Pavlovic [4].
45.3 Impact of Recent Updates
The new RAQDPS020 was run for a six-week summer period in 2016 (July 1–Aug.
14) and a six-week winter period in 2017 (Jan. 1–Feb. 14) for which RAQDPS019
results were already available. Figures 45.1 and 45.2 show mean 48-h variations of
composite surface NO 2 volume mixing ratios (VMR) at measurement stations in
eastern Canada (EC) and the eastern U.S. (EUS) for the summer and winter periods,
respectively. NO 2 emissions were 2% lower in Canada and 33% lower in the U.S.
for the RAQDPS020 runs [3]. The impact of these emissions decreases can be seen
in both figures, and the NO 2 overprediction is reduced in both EC and EUS in the
winter and in the EUS in the summer.
Fig. 45.1 Mean 48-h NO 2 VMR time series (ppbv) for the 45-day summer 2016 period for EC and
EUS