

44 Distinguishing Between Remote and Local Air Pollution …
283
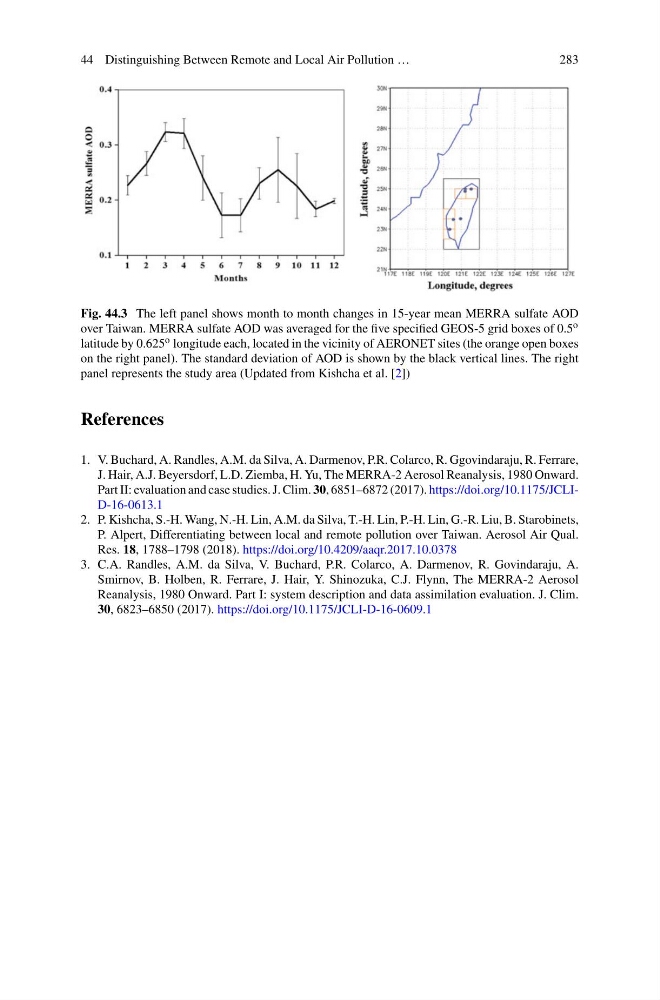
Fig. 44.3 The left panel shows month to month changes in 15-year mean MERRA sulfate AOD
over Taiwan. MERRA sulfate AOD was averaged for the five specified GEOS-5 grid boxes of 0.5 o
latitude by 0.625 o longitude each, located in the vicinity of AERONET sites (the orange open boxes
on the right panel). The standard deviation of AOD is shown by the black vertical lines. The right
panel represents the study area (Updated from Kishcha et al. [2])
References
1. V. Buchard, A. Randles, A.M. da Silva, A. Darmenov, P.R. Colarco, R. Ggovindaraju, R. Ferrare,
J. Hair, A.J. Beyersdorf, L.D. Ziemba, H. Yu, The MERRA-2 Aerosol Reanalysis, 1980 Onward.
Part II: evaluation and case studies. J. Clim. 30, 6851–6872 (2017). https://doi.org/10.1175/JCLID-16-0613.1
2. P. Kishcha, S.-H. Wang, N.-H. Lin, A.M. da Silva, T.-H. Lin, P.-H. Lin, G.-R. Liu, B. Starobinets,
P. Alpert, Differentiating between local and remote pollution over Taiwan. Aerosol Air Qual.
Res. 18, 1788–1798 (2018). https://doi.org/10.4209/aaqr.2017.10.0378
3. C.A. Randles, A.M. da Silva, V. Buchard, P.R. Colarco, A. Darmenov, R. Govindaraju, A.
Smirnov, B. Holben, R. Ferrare, J. Hair, Y. Shinozuka, C.J. Flynn, The MERRA-2 Aerosol
Reanalysis, 1980 Onward. Part I: system description and data assimilation evaluation. J. Clim.
30, 6823–6850 (2017). https://doi.org/10.1175/JCLI-D-16-0609.1
283
Fig. 44.3 The left panel shows month to month changes in 15-year mean MERRA sulfate AOD
over Taiwan. MERRA sulfate AOD was averaged for the five specified GEOS-5 grid boxes of 0.5 o
latitude by 0.625 o longitude each, located in the vicinity of AERONET sites (the orange open boxes
on the right panel). The standard deviation of AOD is shown by the black vertical lines. The right
panel represents the study area (Updated from Kishcha et al. [2])
References
1. V. Buchard, A. Randles, A.M. da Silva, A. Darmenov, P.R. Colarco, R. Ggovindaraju, R. Ferrare,
J. Hair, A.J. Beyersdorf, L.D. Ziemba, H. Yu, The MERRA-2 Aerosol Reanalysis, 1980 Onward.
Part II: evaluation and case studies. J. Clim. 30, 6851–6872 (2017). https://doi.org/10.1175/JCLID-16-0613.1
2. P. Kishcha, S.-H. Wang, N.-H. Lin, A.M. da Silva, T.-H. Lin, P.-H. Lin, G.-R. Liu, B. Starobinets,
P. Alpert, Differentiating between local and remote pollution over Taiwan. Aerosol Air Qual.
Res. 18, 1788–1798 (2018). https://doi.org/10.4209/aaqr.2017.10.0378
3. C.A. Randles, A.M. da Silva, V. Buchard, P.R. Colarco, A. Darmenov, R. Govindaraju, A.
Smirnov, B. Holben, R. Ferrare, J. Hair, Y. Shinozuka, C.J. Flynn, The MERRA-2 Aerosol
Reanalysis, 1980 Onward. Part I: system description and data assimilation evaluation. J. Clim.
30, 6823–6850 (2017). https://doi.org/10.1175/JCLI-D-16-0609.1