

282
P. Kishcha et al.
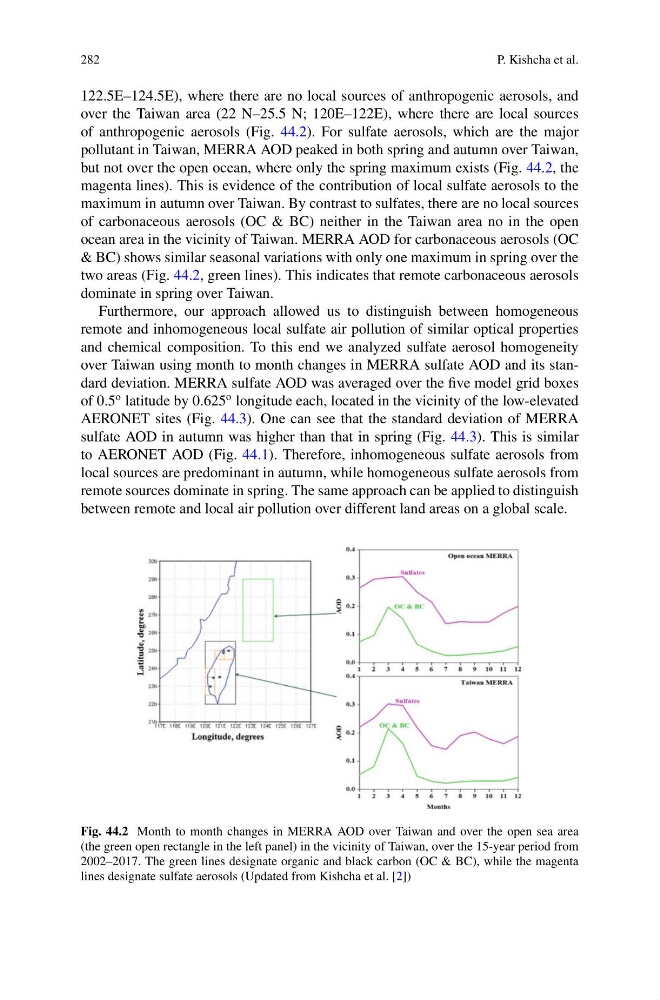
122.5E–124.5E), where there are no local sources of anthropogenic aerosols, and
over the Taiwan area (22 N–25.5 N; 120E–122E), where there are local sources
of anthropogenic aerosols (Fig. 44.2). For sulfate aerosols, which are the major
pollutant in Taiwan, MERRA AOD peaked in both spring and autumn over Taiwan,
but not over the open ocean, where only the spring maximum exists (Fig. 44.2, the
magenta lines). This is evidence of the contribution of local sulfate aerosols to the
maximum in autumn over Taiwan. By contrast to sulfates, there are no local sources
of carbonaceous aerosols (OC & BC) neither in the Taiwan area no in the open
ocean area in the vicinity of Taiwan. MERRA AOD for carbonaceous aerosols (OC
& BC) shows similar seasonal variations with only one maximum in spring over the
two areas (Fig. 44.2, green lines). This indicates that remote carbonaceous aerosols
dominate in spring over Taiwan.
Furthermore, our approach allowed us to distinguish between homogeneous
remote and inhomogeneous local sulfate air pollution of similar optical properties
and chemical composition. To this end we analyzed sulfate aerosol homogeneity
over Taiwan using month to month changes in MERRA sulfate AOD and its standard deviation. MERRA sulfate AOD was averaged over the five model grid boxes
of 0.5
o latitude by 0.625
o longitude each, located in the vicinity of the low-elevated
AERONET sites (Fig. 44.3). One can see that the standard deviation of MERRA
sulfate AOD in autumn was higher than that in spring (Fig. 44.3). This is similar
to AERONET AOD (Fig. 44.1). Therefore, inhomogeneous sulfate aerosols from
local sources are predominant in autumn, while homogeneous sulfate aerosols from
remote sources dominate in spring. The same approach can be applied to distinguish
between remote and local air pollution over different land areas on a global scale.
Fig. 44.2 Month to month changes in MERRA AOD over Taiwan and over the open sea area
(the green open rectangle in the left panel) in the vicinity of Taiwan, over the 15-year period from
2002–2017. The green lines designate organic and black carbon (OC & BC), while the magenta
lines designate sulfate aerosols (Updated from Kishcha et al. [2])
P. Kishcha et al.
122.5E–124.5E), where there are no local sources of anthropogenic aerosols, and
over the Taiwan area (22 N–25.5 N; 120E–122E), where there are local sources
of anthropogenic aerosols (Fig. 44.2). For sulfate aerosols, which are the major
pollutant in Taiwan, MERRA AOD peaked in both spring and autumn over Taiwan,
but not over the open ocean, where only the spring maximum exists (Fig. 44.2, the
magenta lines). This is evidence of the contribution of local sulfate aerosols to the
maximum in autumn over Taiwan. By contrast to sulfates, there are no local sources
of carbonaceous aerosols (OC & BC) neither in the Taiwan area no in the open
ocean area in the vicinity of Taiwan. MERRA AOD for carbonaceous aerosols (OC
& BC) shows similar seasonal variations with only one maximum in spring over the
two areas (Fig. 44.2, green lines). This indicates that remote carbonaceous aerosols
dominate in spring over Taiwan.
Furthermore, our approach allowed us to distinguish between homogeneous
remote and inhomogeneous local sulfate air pollution of similar optical properties
and chemical composition. To this end we analyzed sulfate aerosol homogeneity
over Taiwan using month to month changes in MERRA sulfate AOD and its standard deviation. MERRA sulfate AOD was averaged over the five model grid boxes
of 0.5
o latitude by 0.625
o longitude each, located in the vicinity of the low-elevated
AERONET sites (Fig. 44.3). One can see that the standard deviation of MERRA
sulfate AOD in autumn was higher than that in spring (Fig. 44.3). This is similar
to AERONET AOD (Fig. 44.1). Therefore, inhomogeneous sulfate aerosols from
local sources are predominant in autumn, while homogeneous sulfate aerosols from
remote sources dominate in spring. The same approach can be applied to distinguish
between remote and local air pollution over different land areas on a global scale.
Fig. 44.2 Month to month changes in MERRA AOD over Taiwan and over the open sea area
(the green open rectangle in the left panel) in the vicinity of Taiwan, over the 15-year period from
2002–2017. The green lines designate organic and black carbon (OC & BC), while the magenta
lines designate sulfate aerosols (Updated from Kishcha et al. [2])