

40 Total Deposition Maps Evaluated from Measurement-Model Fusion …
257
Error
statistics
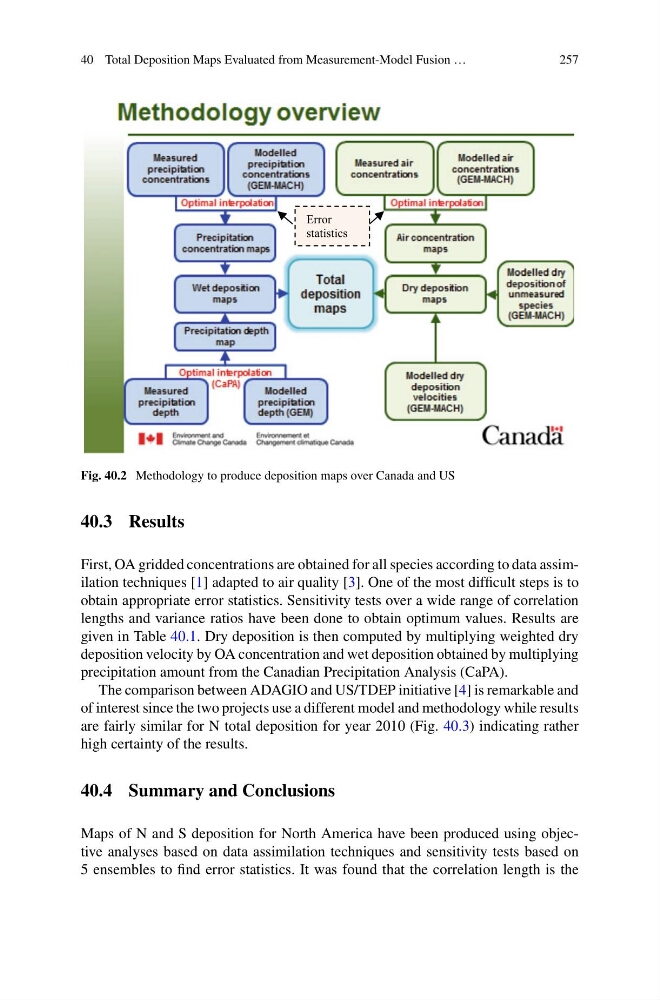
Fig. 40.2 Methodology to produce deposition maps over Canada and US
40.3 Results
First, OA gridded concentrations are obtained for all species according to data assimilation techniques [1] adapted to air quality [3]. One of the most difficult steps is to
obtain appropriate error statistics. Sensitivity tests over a wide range of correlation
lengths and variance ratios have been done to obtain optimum values. Results are
given in Table 40.1. Dry deposition is then computed by multiplying weighted dry
deposition velocity by OA concentration and wet deposition obtained by multiplying
precipitation amount from the Canadian Precipitation Analysis (CaPA).
The comparison between ADAGIO and US/TDEP initiative [4] is remarkable and
of interest since the two projects use a different model and methodology while results
are fairly similar for N total deposition for year 2010 (Fig. 40.3) indicating rather
high certainty of the results.
40.4 Summary and Conclusions
Maps of N and S deposition for North America have been produced using objective analyses based on data assimilation techniques and sensitivity tests based on
5 ensembles to find error statistics. It was found that the correlation length is the
257
Error
statistics
Fig. 40.2 Methodology to produce deposition maps over Canada and US
40.3 Results
First, OA gridded concentrations are obtained for all species according to data assimilation techniques [1] adapted to air quality [3]. One of the most difficult steps is to
obtain appropriate error statistics. Sensitivity tests over a wide range of correlation
lengths and variance ratios have been done to obtain optimum values. Results are
given in Table 40.1. Dry deposition is then computed by multiplying weighted dry
deposition velocity by OA concentration and wet deposition obtained by multiplying
precipitation amount from the Canadian Precipitation Analysis (CaPA).
The comparison between ADAGIO and US/TDEP initiative [4] is remarkable and
of interest since the two projects use a different model and methodology while results
are fairly similar for N total deposition for year 2010 (Fig. 40.3) indicating rather
high certainty of the results.
40.4 Summary and Conclusions
Maps of N and S deposition for North America have been produced using objective analyses based on data assimilation techniques and sensitivity tests based on
5 ensembles to find error statistics. It was found that the correlation length is the