

252
P. Lee et al.
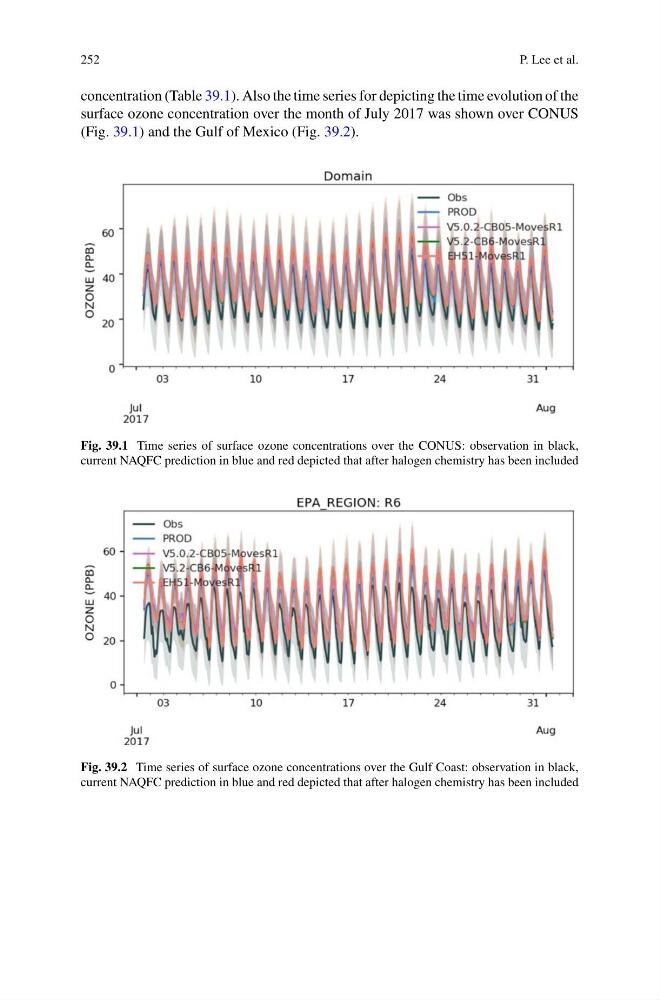
concentration (Table 39.1). Also the time series for depicting the time evolution of the
surface ozone concentration over the month of July 2017 was shown over CONUS
(Fig. 39.1) and the Gulf of Mexico (Fig. 39.2).
Fig. 39.1 Time series of surface ozone concentrations over the CONUS: observation in black,
current NAQFC prediction in blue and red depicted that after halogen chemistry has been included
Fig. 39.2 Time series of surface ozone concentrations over the Gulf Coast: observation in black,
current NAQFC prediction in blue and red depicted that after halogen chemistry has been included
P. Lee et al.
concentration (Table 39.1). Also the time series for depicting the time evolution of the
surface ozone concentration over the month of July 2017 was shown over CONUS
(Fig. 39.1) and the Gulf of Mexico (Fig. 39.2).
Fig. 39.1 Time series of surface ozone concentrations over the CONUS: observation in black,
current NAQFC prediction in blue and red depicted that after halogen chemistry has been included
Fig. 39.2 Time series of surface ozone concentrations over the Gulf Coast: observation in black,
current NAQFC prediction in blue and red depicted that after halogen chemistry has been included