

246
A. Uppstu et al.
Table 38.2 Quantitative performance of the forecast based on Eq. (38.1)
Average
90th percentile
98th percentile
Model accuracy (%)
99.5
99.4
99.0
Probability of detection (%)
55
74
84
False alarm rate (%)
43
54
72
Probability of false detection (%)
0.24
0.50
1.25
Bias (%)
−3
60
199
Odds ratio
504
572
419
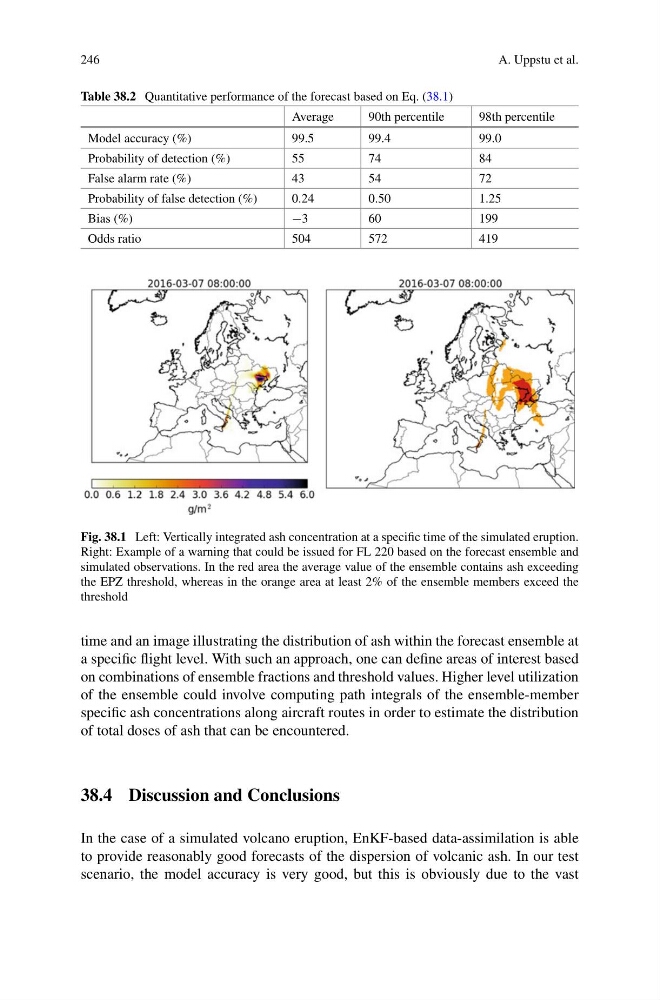
Fig. 38.1 Left: Vertically integrated ash concentration at a specific time of the simulated eruption.
Right: Example of a warning that could be issued for FL 220 based on the forecast ensemble and
simulated observations. In the red area the average value of the ensemble contains ash exceeding
the EPZ threshold, whereas in the orange area at least 2% of the ensemble members exceed the
threshold
time and an image illustrating the distribution of ash within the forecast ensemble at
a specific flight level. With such an approach, one can define areas of interest based
on combinations of ensemble fractions and threshold values. Higher level utilization
of the ensemble could involve computing path integrals of the ensemble-member
specific ash concentrations along aircraft routes in order to estimate the distribution
of total doses of ash that can be encountered.
38.4 Discussion and Conclusions
In the case of a simulated volcano eruption, EnKF-based data-assimilation is able
to provide reasonably good forecasts of the dispersion of volcanic ash. In our test
scenario, the model accuracy is very good, but this is obviously due to the vast
A. Uppstu et al.
Table 38.2 Quantitative performance of the forecast based on Eq. (38.1)
Average
90th percentile
98th percentile
Model accuracy (%)
99.5
99.4
99.0
Probability of detection (%)
55
74
84
False alarm rate (%)
43
54
72
Probability of false detection (%)
0.24
0.50
1.25
Bias (%)
−3
60
199
Odds ratio
504
572
419
Fig. 38.1 Left: Vertically integrated ash concentration at a specific time of the simulated eruption.
Right: Example of a warning that could be issued for FL 220 based on the forecast ensemble and
simulated observations. In the red area the average value of the ensemble contains ash exceeding
the EPZ threshold, whereas in the orange area at least 2% of the ensemble members exceed the
threshold
time and an image illustrating the distribution of ash within the forecast ensemble at
a specific flight level. With such an approach, one can define areas of interest based
on combinations of ensemble fractions and threshold values. Higher level utilization
of the ensemble could involve computing path integrals of the ensemble-member
specific ash concentrations along aircraft routes in order to estimate the distribution
of total doses of ash that can be encountered.
38.4 Discussion and Conclusions
In the case of a simulated volcano eruption, EnKF-based data-assimilation is able
to provide reasonably good forecasts of the dispersion of volcanic ash. In our test
scenario, the model accuracy is very good, but this is obviously due to the vast