

38 Ensemble-Based Data Assimilation and Forecasting of Volcanic Ash
245
using readily available data of the satellite orbital parameters and lidar station locations. The simulated retrievals were perturbed with a normally distributed relative
random error of 0.2 times the retrieved value and additionally a normally distributed
random error of 0.04 mg/m
3 for the concentrations and of 20 mg/m
3 for the integrated
columns.
The eruption was simulated using meteorological data based on the European
Centre for Medium-Range Weather Forecasts (ECMWF) ERA-Interim reanalysis
dataset [1], whereas in the assimilation of the simulated observations, the meteorological data was obtained from the ECMWF operational forecasts. Both the simulation and the assimilation were performed using a 0.25° × 0.25° grid with 28 vertical
levels up to an altitude of 12,250 m.
38.3 Results
In order to quantify the performance of the forecast, we have analyzed how well the
data assimilation is able to predict simulation cells with a concentration of greater
than 200 mg/m
3 , which is the threshold for the Enhanced Procedures Zone (EPZ)
defined by UK Civil Aviation Authority [5]. We thus classify cells based on whether
an ash concentration exceeding the EPZ threshold is present or not in the simulation,
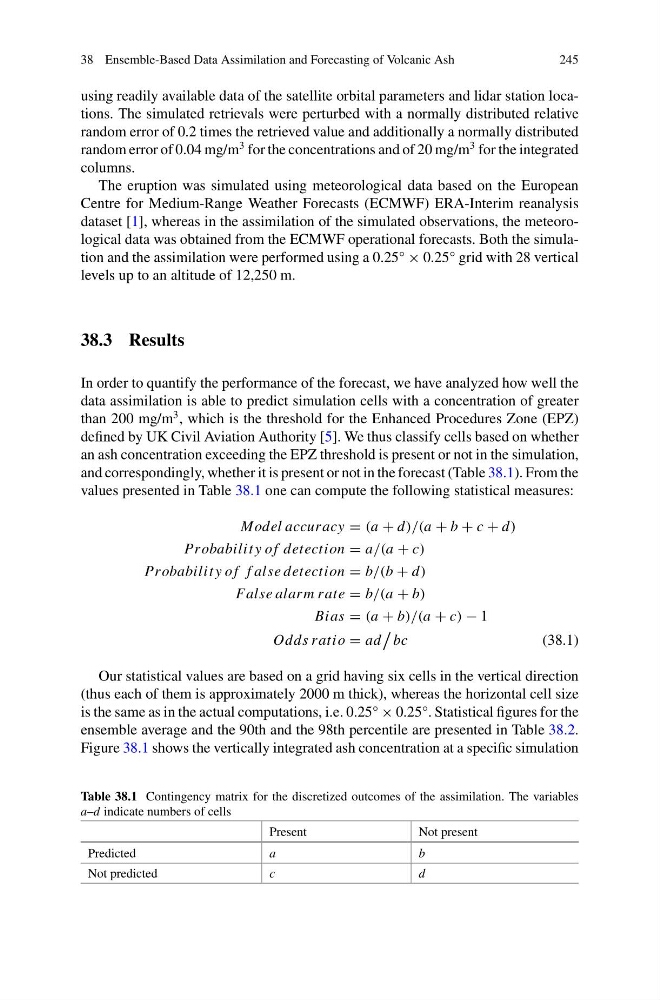
and correspondingly, whether it is present or not in the forecast (Table 38.1). From the
values presented in Table 38.1 one can compute the following statistical measures:
Model accuracy = (a + d)/(a + b + c + d)
Probabilit y o f detection = a/(a + c)
Probabilit y of f alse detection = b/(b + d)
False alarm rate = b/(a + b)
Bias = (a + b)/(a + c) − 1
Odds ratio = ad
bc
(38.1)
Our statistical values are based on a grid having six cells in the vertical direction
(thus each of them is approximately 2000 m thick), whereas the horizontal cell size
is the same as in the actual computations, i.e. 0.25° × 0.25°. Statistical figures for the
ensemble average and the 90th and the 98th percentile are presented in Table 38.2.
Figure 38.1 shows the vertically integrated ash concentration at a specific simulation
Table 38.1 Contingency matrix for the discretized outcomes of the assimilation. The variables
a–d indicate numbers of cells
Present
Not present
Predicted
a
b
Not predicted
c
d
245
using readily available data of the satellite orbital parameters and lidar station locations. The simulated retrievals were perturbed with a normally distributed relative
random error of 0.2 times the retrieved value and additionally a normally distributed
random error of 0.04 mg/m
3 for the concentrations and of 20 mg/m
3 for the integrated
columns.
The eruption was simulated using meteorological data based on the European
Centre for Medium-Range Weather Forecasts (ECMWF) ERA-Interim reanalysis
dataset [1], whereas in the assimilation of the simulated observations, the meteorological data was obtained from the ECMWF operational forecasts. Both the simulation and the assimilation were performed using a 0.25° × 0.25° grid with 28 vertical
levels up to an altitude of 12,250 m.
38.3 Results
In order to quantify the performance of the forecast, we have analyzed how well the
data assimilation is able to predict simulation cells with a concentration of greater
than 200 mg/m
3 , which is the threshold for the Enhanced Procedures Zone (EPZ)
defined by UK Civil Aviation Authority [5]. We thus classify cells based on whether
an ash concentration exceeding the EPZ threshold is present or not in the simulation,
and correspondingly, whether it is present or not in the forecast (Table 38.1). From the
values presented in Table 38.1 one can compute the following statistical measures:
Model accuracy = (a + d)/(a + b + c + d)
Probabilit y o f detection = a/(a + c)
Probabilit y of f alse detection = b/(b + d)
False alarm rate = b/(a + b)
Bias = (a + b)/(a + c) − 1
Odds ratio = ad
bc
(38.1)
Our statistical values are based on a grid having six cells in the vertical direction
(thus each of them is approximately 2000 m thick), whereas the horizontal cell size
is the same as in the actual computations, i.e. 0.25° × 0.25°. Statistical figures for the
ensemble average and the 90th and the 98th percentile are presented in Table 38.2.
Figure 38.1 shows the vertically integrated ash concentration at a specific simulation
Table 38.1 Contingency matrix for the discretized outcomes of the assimilation. The variables
a–d indicate numbers of cells
Present
Not present
Predicted
a
b
Not predicted
c
d