

35 Experimental Forecasting Using the High-Resolution Research …
229
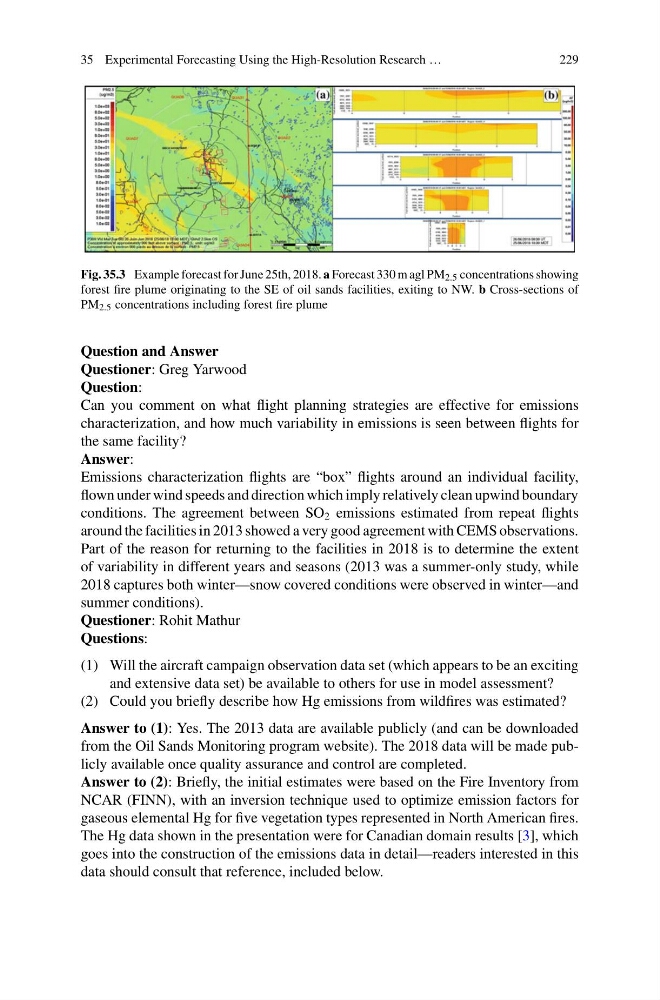
Fig. 35.3 Example forecast for June 25th, 2018. a Forecast 330 m agl PM 2.5 concentrations showing
forest fire plume originating to the SE of oil sands facilities, exiting to NW. b Cross-sections of
PM 2.5 concentrations including forest fire plume
Question and Answer
Questioner: Greg Yarwood
Question:
Can you comment on what flight planning strategies are effective for emissions
characterization, and how much variability in emissions is seen between flights for
the same facility?
Answer:
Emissions characterization flights are “box” flights around an individual facility,
flown under wind speeds and direction which imply relatively clean upwind boundary
conditions. The agreement between SO 2 emissions estimated from repeat flights
around the facilities in 2013 showed a very good agreement with CEMS observations.
Part of the reason for returning to the facilities in 2018 is to determine the extent
of variability in different years and seasons (2013 was a summer-only study, while
2018 captures both winter—snow covered conditions were observed in winter—and
summer conditions).
Questioner: Rohit Mathur
Questions:
(1) Will the aircraft campaign observation data set (which appears to be an exciting
and extensive data set) be available to others for use in model assessment?
(2) Could you briefly describe how Hg emissions from wildfires was estimated?
Answer to (1): Yes. The 2013 data are available publicly (and can be downloaded
from the Oil Sands Monitoring program website). The 2018 data will be made publicly available once quality assurance and control are completed.
Answer to (2): Briefly, the initial estimates were based on the Fire Inventory from
NCAR (FINN), with an inversion technique used to optimize emission factors for
gaseous elemental Hg for five vegetation types represented in North American fires.
The Hg data shown in the presentation were for Canadian domain results [3], which
goes into the construction of the emissions data in detail—readers interested in this
data should consult that reference, included below.
229
Fig. 35.3 Example forecast for June 25th, 2018. a Forecast 330 m agl PM 2.5 concentrations showing
forest fire plume originating to the SE of oil sands facilities, exiting to NW. b Cross-sections of
PM 2.5 concentrations including forest fire plume
Question and Answer
Questioner: Greg Yarwood
Question:
Can you comment on what flight planning strategies are effective for emissions
characterization, and how much variability in emissions is seen between flights for
the same facility?
Answer:
Emissions characterization flights are “box” flights around an individual facility,
flown under wind speeds and direction which imply relatively clean upwind boundary
conditions. The agreement between SO 2 emissions estimated from repeat flights
around the facilities in 2013 showed a very good agreement with CEMS observations.
Part of the reason for returning to the facilities in 2018 is to determine the extent
of variability in different years and seasons (2013 was a summer-only study, while
2018 captures both winter—snow covered conditions were observed in winter—and
summer conditions).
Questioner: Rohit Mathur
Questions:
(1) Will the aircraft campaign observation data set (which appears to be an exciting
and extensive data set) be available to others for use in model assessment?
(2) Could you briefly describe how Hg emissions from wildfires was estimated?
Answer to (1): Yes. The 2013 data are available publicly (and can be downloaded
from the Oil Sands Monitoring program website). The 2018 data will be made publicly available once quality assurance and control are completed.
Answer to (2): Briefly, the initial estimates were based on the Fire Inventory from
NCAR (FINN), with an inversion technique used to optimize emission factors for
gaseous elemental Hg for five vegetation types represented in North American fires.
The Hg data shown in the presentation were for Canadian domain results [3], which
goes into the construction of the emissions data in detail—readers interested in this
data should consult that reference, included below.