

202
N. Karvosenoja et al.
using population density data as a proxy. This has been improved to more diverse
proxy types given in Table 31.2.
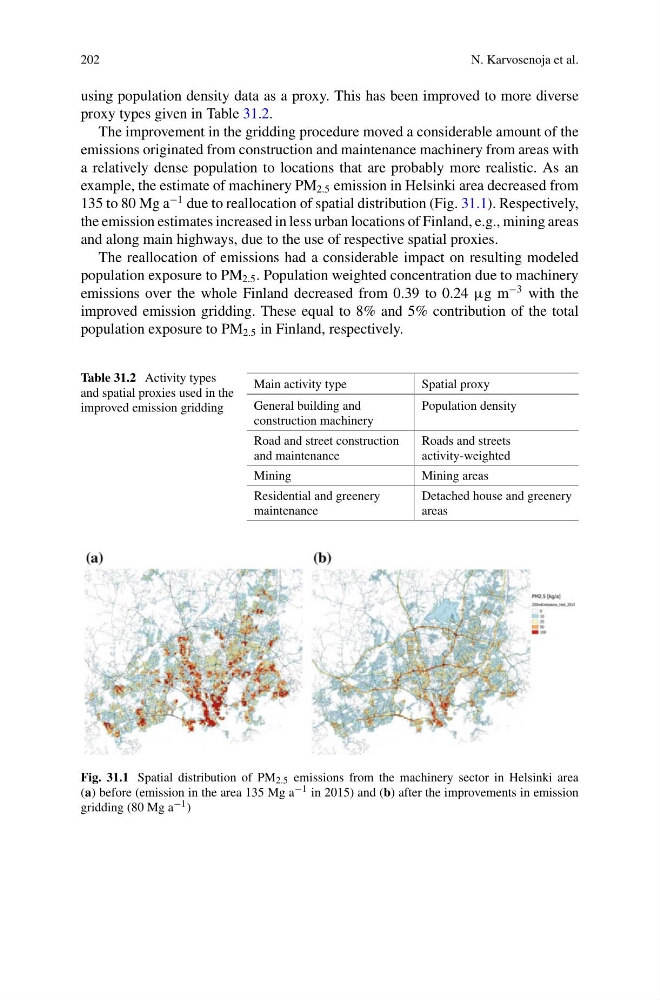
The improvement in the gridding procedure moved a considerable amount of the
emissions originated from construction and maintenance machinery from areas with
a relatively dense population to locations that are probably more realistic. As an
example, the estimate of machinery PM 2.5 emission in Helsinki area decreased from
135 to 80 Mg a
−1 due to reallocation of spatial distribution (Fig. 31.1). Respectively,
the emission estimates increased in less urban locations of Finland, e.g., mining areas
and along main highways, due to the use of respective spatial proxies.
The reallocation of emissions had a considerable impact on resulting modeled
population exposure to PM 2.5 . Population weighted concentration due to machinery
emissions over the whole Finland decreased from 0.39 to 0.24 µg m
−3 with the
improved emission gridding. These equal to 8% and 5% contribution of the total
population exposure to PM 2.5 in Finland, respectively.
Table 31.2 Activity types
and spatial proxies used in the
improved emission gridding
Main activity type
Spatial proxy
General building and
construction machinery
Population density
Road and street construction
and maintenance
Roads and streets
activity-weighted
Mining
Mining areas
Residential and greenery
maintenance
Detached house and greenery
areas
Fig. 31.1 Spatial distribution of PM 2.5 emissions from the machinery sector in Helsinki area
(a) before (emission in the area 135 Mg a −1 in 2015) and (b) after the improvements in emission
gridding (80 Mg a −1 )
N. Karvosenoja et al.
using population density data as a proxy. This has been improved to more diverse
proxy types given in Table 31.2.
The improvement in the gridding procedure moved a considerable amount of the
emissions originated from construction and maintenance machinery from areas with
a relatively dense population to locations that are probably more realistic. As an
example, the estimate of machinery PM 2.5 emission in Helsinki area decreased from
135 to 80 Mg a
−1 due to reallocation of spatial distribution (Fig. 31.1). Respectively,
the emission estimates increased in less urban locations of Finland, e.g., mining areas
and along main highways, due to the use of respective spatial proxies.
The reallocation of emissions had a considerable impact on resulting modeled
population exposure to PM 2.5 . Population weighted concentration due to machinery
emissions over the whole Finland decreased from 0.39 to 0.24 µg m
−3 with the
improved emission gridding. These equal to 8% and 5% contribution of the total
population exposure to PM 2.5 in Finland, respectively.
Table 31.2 Activity types
and spatial proxies used in the
improved emission gridding
Main activity type
Spatial proxy
General building and
construction machinery
Population density
Road and street construction
and maintenance
Roads and streets
activity-weighted
Mining
Mining areas
Residential and greenery
maintenance
Detached house and greenery
areas
Fig. 31.1 Spatial distribution of PM 2.5 emissions from the machinery sector in Helsinki area
(a) before (emission in the area 135 Mg a −1 in 2015) and (b) after the improvements in emission
gridding (80 Mg a −1 )