

150
V. Rodrigues et al.
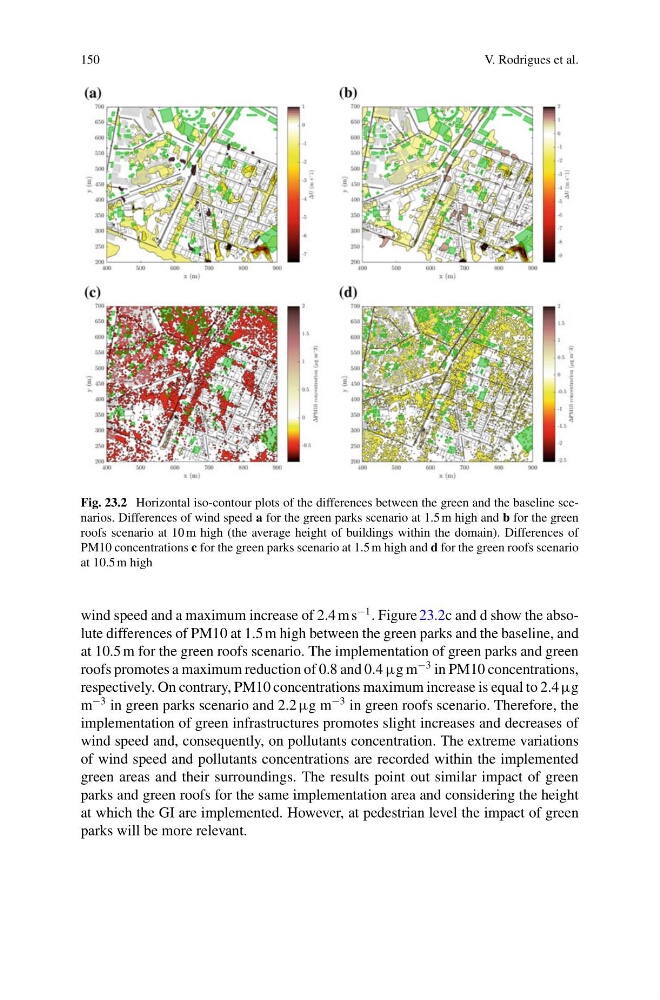
Fig. 23.2 Horizontal iso-contour plots of the differences between the green and the baseline scenarios. Differences of wind speed a for the green parks scenario at 1.5 m high and b for the green
roofs scenario at 10 m high (the average height of buildings within the domain). Differences of
PM10 concentrations c for the green parks scenario at 1.5 m high and d for the green roofs scenario
at 10.5 m high
wind speed and a maximum increase of 2.4 m s
−1 . Figure 23.2c and d show the absolute differences of PM10 at 1.5 m high between the green parks and the baseline, and
at 10.5 m for the green roofs scenario. The implementation of green parks and green
roofs promotes a maximum reduction of 0.8 and 0.4 µg m
−3 in PM10 concentrations,
respectively. On contrary, PM10 concentrations maximum increase is equal to 2.4 µg
m
−3 in green parks scenario and 2.2 µg m
−3 in green roofs scenario. Therefore, the
implementation of green infrastructures promotes slight increases and decreases of
wind speed and, consequently, on pollutants concentration. The extreme variations
of wind speed and pollutants concentrations are recorded within the implemented
green areas and their surroundings. The results point out similar impact of green
parks and green roofs for the same implementation area and considering the height
at which the GI are implemented. However, at pedestrian level the impact of green
parks will be more relevant.
V. Rodrigues et al.
Fig. 23.2 Horizontal iso-contour plots of the differences between the green and the baseline scenarios. Differences of wind speed a for the green parks scenario at 1.5 m high and b for the green
roofs scenario at 10 m high (the average height of buildings within the domain). Differences of
PM10 concentrations c for the green parks scenario at 1.5 m high and d for the green roofs scenario
at 10.5 m high
wind speed and a maximum increase of 2.4 m s
−1 . Figure 23.2c and d show the absolute differences of PM10 at 1.5 m high between the green parks and the baseline, and
at 10.5 m for the green roofs scenario. The implementation of green parks and green
roofs promotes a maximum reduction of 0.8 and 0.4 µg m
−3 in PM10 concentrations,
respectively. On contrary, PM10 concentrations maximum increase is equal to 2.4 µg
m
−3 in green parks scenario and 2.2 µg m
−3 in green roofs scenario. Therefore, the
implementation of green infrastructures promotes slight increases and decreases of
wind speed and, consequently, on pollutants concentration. The extreme variations
of wind speed and pollutants concentrations are recorded within the implemented
green areas and their surroundings. The results point out similar impact of green
parks and green roofs for the same implementation area and considering the height
at which the GI are implemented. However, at pedestrian level the impact of green
parks will be more relevant.