

23 Modelling the Potential of Green Infrastructures to Reduce …
149
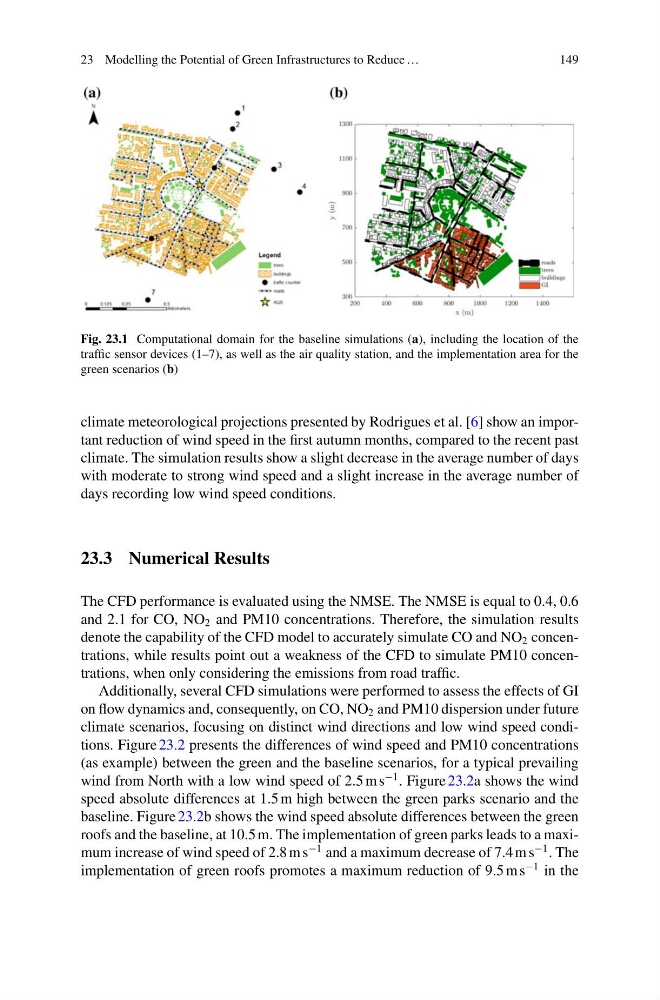
Fig. 23.1 Computational domain for the baseline simulations (a), including the location of the
traffic sensor devices (1–7), as well as the air quality station, and the implementation area for the
green scenarios (b)
climate meteorological projections presented by Rodrigues et al. [6] show an important reduction of wind speed in the first autumn months, compared to the recent past
climate. The simulation results show a slight decrease in the average number of days
with moderate to strong wind speed and a slight increase in the average number of
days recording low wind speed conditions.
23.3 Numerical Results
The CFD performance is evaluated using the NMSE. The NMSE is equal to 0.4, 0.6
and 2.1 for CO, NO 2 and PM10 concentrations. Therefore, the simulation results
denote the capability of the CFD model to accurately simulate CO and NO 2 concentrations, while results point out a weakness of the CFD to simulate PM10 concentrations, when only considering the emissions from road traffic.
Additionally, several CFD simulations were performed to assess the effects of GI
on flow dynamics and, consequently, on CO, NO 2 and PM10 dispersion under future
climate scenarios, focusing on distinct wind directions and low wind speed conditions. Figure 23.2 presents the differences of wind speed and PM10 concentrations
(as example) between the green and the baseline scenarios, for a typical prevailing
wind from North with a low wind speed of 2.5 m s
−1 . Figure 23.2a shows the wind
speed absolute differences at 1.5 m high between the green parks scenario and the
baseline. Figure 23.2b shows the wind speed absolute differences between the green
roofs and the baseline, at 10.5 m. The implementation of green parks leads to a maximum increase of wind speed of 2.8 m s
−1 and a maximum decrease of 7.4 m s
−1 . The
implementation of green roofs promotes a maximum reduction of 9.5 m s
−1 in the
149
Fig. 23.1 Computational domain for the baseline simulations (a), including the location of the
traffic sensor devices (1–7), as well as the air quality station, and the implementation area for the
green scenarios (b)
climate meteorological projections presented by Rodrigues et al. [6] show an important reduction of wind speed in the first autumn months, compared to the recent past
climate. The simulation results show a slight decrease in the average number of days
with moderate to strong wind speed and a slight increase in the average number of
days recording low wind speed conditions.
23.3 Numerical Results
The CFD performance is evaluated using the NMSE. The NMSE is equal to 0.4, 0.6
and 2.1 for CO, NO 2 and PM10 concentrations. Therefore, the simulation results
denote the capability of the CFD model to accurately simulate CO and NO 2 concentrations, while results point out a weakness of the CFD to simulate PM10 concentrations, when only considering the emissions from road traffic.
Additionally, several CFD simulations were performed to assess the effects of GI
on flow dynamics and, consequently, on CO, NO 2 and PM10 dispersion under future
climate scenarios, focusing on distinct wind directions and low wind speed conditions. Figure 23.2 presents the differences of wind speed and PM10 concentrations
(as example) between the green and the baseline scenarios, for a typical prevailing
wind from North with a low wind speed of 2.5 m s
−1 . Figure 23.2a shows the wind
speed absolute differences at 1.5 m high between the green parks scenario and the
baseline. Figure 23.2b shows the wind speed absolute differences between the green
roofs and the baseline, at 10.5 m. The implementation of green parks leads to a maximum increase of wind speed of 2.8 m s
−1 and a maximum decrease of 7.4 m s
−1 . The
implementation of green roofs promotes a maximum reduction of 9.5 m s
−1 in the