

134
L. T. Molina et al.
Queretaro
Pachuca
Tula
Toluca
CDMX
Cuernavaca
Puebla
Effects of emission control on O 3
-100
-99.5
-99
-98.5
-100
-99.5
-99
-98.5
Queretaro
Pachuca
Tula
Toluca
CDMX
Cuernavaca
Puebla
O 3 at hr 15, 0410-0415, 2014
-100
-99.5
-99
-98.5
-100
-99.5
-99
-98.5
18.5
19
19.5
20
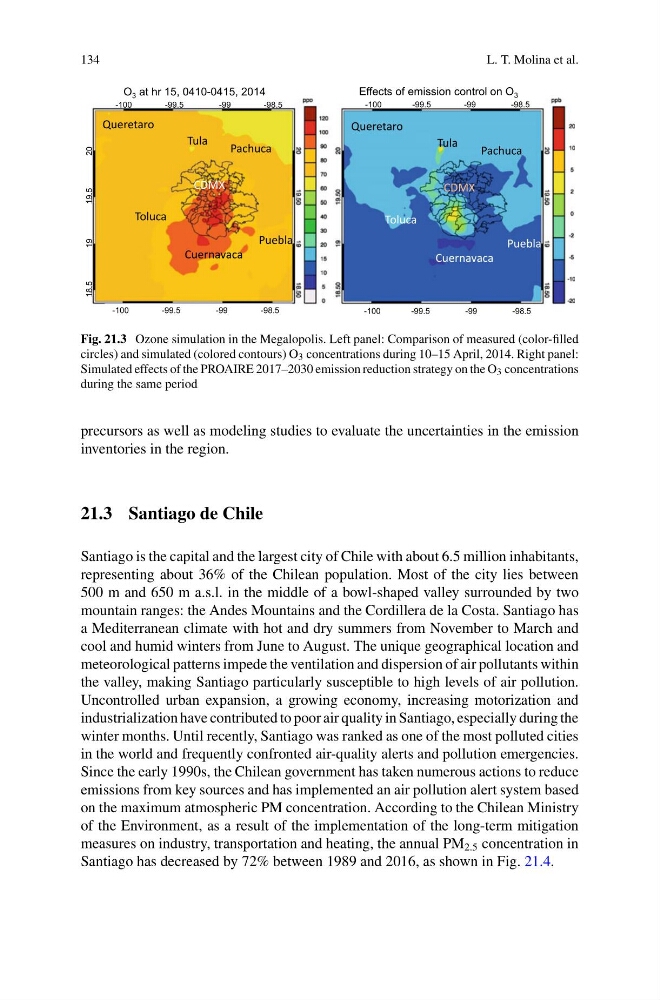
Fig. 21.3 Ozone simulation in the Megalopolis. Left panel: Comparison of measured (color-filled
circles) and simulated (colored contours) O 3 concentrations during 10–15 April, 2014. Right panel:
Simulated effects of the PROAIRE 2017–2030 emission reduction strategy on the O 3 concentrations
during the same period
precursors as well as modeling studies to evaluate the uncertainties in the emission
inventories in the region.
21.3 Santiago de Chile
Santiago is the capital and the largest city of Chile with about 6.5 million inhabitants,
representing about 36% of the Chilean population. Most of the city lies between
500 m and 650 m a.s.l. in the middle of a bowl-shaped valley surrounded by two
mountain ranges: the Andes Mountains and the Cordillera de la Costa. Santiago has
a Mediterranean climate with hot and dry summers from November to March and
cool and humid winters from June to August. The unique geographical location and
meteorological patterns impede the ventilation and dispersion of air pollutants within
the valley, making Santiago particularly susceptible to high levels of air pollution.
Uncontrolled urban expansion, a growing economy, increasing motorization and
industrialization have contributed to poor air quality in Santiago, especially during the
winter months. Until recently, Santiago was ranked as one of the most polluted cities
in the world and frequently confronted air-quality alerts and pollution emergencies.
Since the early 1990s, the Chilean government has taken numerous actions to reduce
emissions from key sources and has implemented an air pollution alert system based
on the maximum atmospheric PM concentration. According to the Chilean Ministry
of the Environment, as a result of the implementation of the long-term mitigation
measures on industry, transportation and heating, the annual PM 2.5 concentration in
Santiago has decreased by 72% between 1989 and 2016, as shown in Fig. 21.4.
L. T. Molina et al.
Queretaro
Pachuca
Tula
Toluca
CDMX
Cuernavaca
Puebla
Effects of emission control on O 3
-100
-99.5
-99
-98.5
-100
-99.5
-99
-98.5
Queretaro
Pachuca
Tula
Toluca
CDMX
Cuernavaca
Puebla
O 3 at hr 15, 0410-0415, 2014
-100
-99.5
-99
-98.5
-100
-99.5
-99
-98.5
18.5
19
19.5
20
Fig. 21.3 Ozone simulation in the Megalopolis. Left panel: Comparison of measured (color-filled
circles) and simulated (colored contours) O 3 concentrations during 10–15 April, 2014. Right panel:
Simulated effects of the PROAIRE 2017–2030 emission reduction strategy on the O 3 concentrations
during the same period
precursors as well as modeling studies to evaluate the uncertainties in the emission
inventories in the region.
21.3 Santiago de Chile
Santiago is the capital and the largest city of Chile with about 6.5 million inhabitants,
representing about 36% of the Chilean population. Most of the city lies between
500 m and 650 m a.s.l. in the middle of a bowl-shaped valley surrounded by two
mountain ranges: the Andes Mountains and the Cordillera de la Costa. Santiago has
a Mediterranean climate with hot and dry summers from November to March and
cool and humid winters from June to August. The unique geographical location and
meteorological patterns impede the ventilation and dispersion of air pollutants within
the valley, making Santiago particularly susceptible to high levels of air pollution.
Uncontrolled urban expansion, a growing economy, increasing motorization and
industrialization have contributed to poor air quality in Santiago, especially during the
winter months. Until recently, Santiago was ranked as one of the most polluted cities
in the world and frequently confronted air-quality alerts and pollution emergencies.
Since the early 1990s, the Chilean government has taken numerous actions to reduce
emissions from key sources and has implemented an air pollution alert system based
on the maximum atmospheric PM concentration. According to the Chilean Ministry
of the Environment, as a result of the implementation of the long-term mitigation
measures on industry, transportation and heating, the annual PM 2.5 concentration in
Santiago has decreased by 72% between 1989 and 2016, as shown in Fig. 21.4.