

17 Using Higher Order Sensitivity Approaches …
103
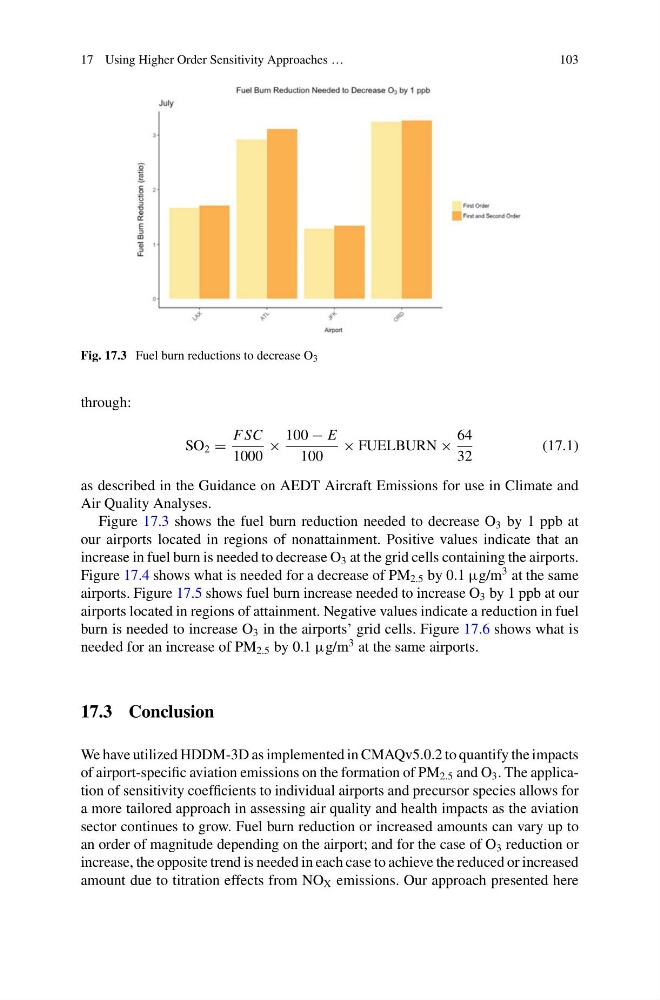
Fig. 17.3 Fuel burn reductions to decrease O 3
through:
SO 2 =
F SC
1000
×
100 − E
100
× FUELBURN ×
64
32
(17.1)
as described in the Guidance on AEDT Aircraft Emissions for use in Climate and
Air Quality Analyses.
Figure 17.3 shows the fuel burn reduction needed to decrease O 3 by 1 ppb at
our airports located in regions of nonattainment. Positive values indicate that an
increase in fuel burn is needed to decrease O 3 at the grid cells containing the airports.
Figure 17.4 shows what is needed for a decrease of PM 2.5 by 0.1 µg/m
3 at the same
airports. Figure 17.5 shows fuel burn increase needed to increase O 3 by 1 ppb at our
airports located in regions of attainment. Negative values indicate a reduction in fuel
burn is needed to increase O 3 in the airports’ grid cells. Figure 17.6 shows what is
needed for an increase of PM 2.5 by 0.1 µg/m
3 at the same airports.
17.3 Conclusion
We have utilized HDDM-3D as implemented in CMAQv5.0.2 to quantify the impacts
of airport-specific aviation emissions on the formation of PM 2.5 and O 3 . The application of sensitivity coefficients to individual airports and precursor species allows for
a more tailored approach in assessing air quality and health impacts as the aviation
sector continues to grow. Fuel burn reduction or increased amounts can vary up to
an order of magnitude depending on the airport; and for the case of O 3 reduction or
increase, the opposite trend is needed in each case to achieve the reduced or increased
amount due to titration effects from NO X emissions. Our approach presented here
103
Fig. 17.3 Fuel burn reductions to decrease O 3
through:
SO 2 =
F SC
1000
×
100 − E
100
× FUELBURN ×
64
32
(17.1)
as described in the Guidance on AEDT Aircraft Emissions for use in Climate and
Air Quality Analyses.
Figure 17.3 shows the fuel burn reduction needed to decrease O 3 by 1 ppb at
our airports located in regions of nonattainment. Positive values indicate that an
increase in fuel burn is needed to decrease O 3 at the grid cells containing the airports.
Figure 17.4 shows what is needed for a decrease of PM 2.5 by 0.1 µg/m
3 at the same
airports. Figure 17.5 shows fuel burn increase needed to increase O 3 by 1 ppb at our
airports located in regions of attainment. Negative values indicate a reduction in fuel
burn is needed to increase O 3 in the airports’ grid cells. Figure 17.6 shows what is
needed for an increase of PM 2.5 by 0.1 µg/m
3 at the same airports.
17.3 Conclusion
We have utilized HDDM-3D as implemented in CMAQv5.0.2 to quantify the impacts
of airport-specific aviation emissions on the formation of PM 2.5 and O 3 . The application of sensitivity coefficients to individual airports and precursor species allows for
a more tailored approach in assessing air quality and health impacts as the aviation
sector continues to grow. Fuel burn reduction or increased amounts can vary up to
an order of magnitude depending on the airport; and for the case of O 3 reduction or
increase, the opposite trend is needed in each case to achieve the reduced or increased
amount due to titration effects from NO X emissions. Our approach presented here