

102
C. Arter and S. Arunachalam
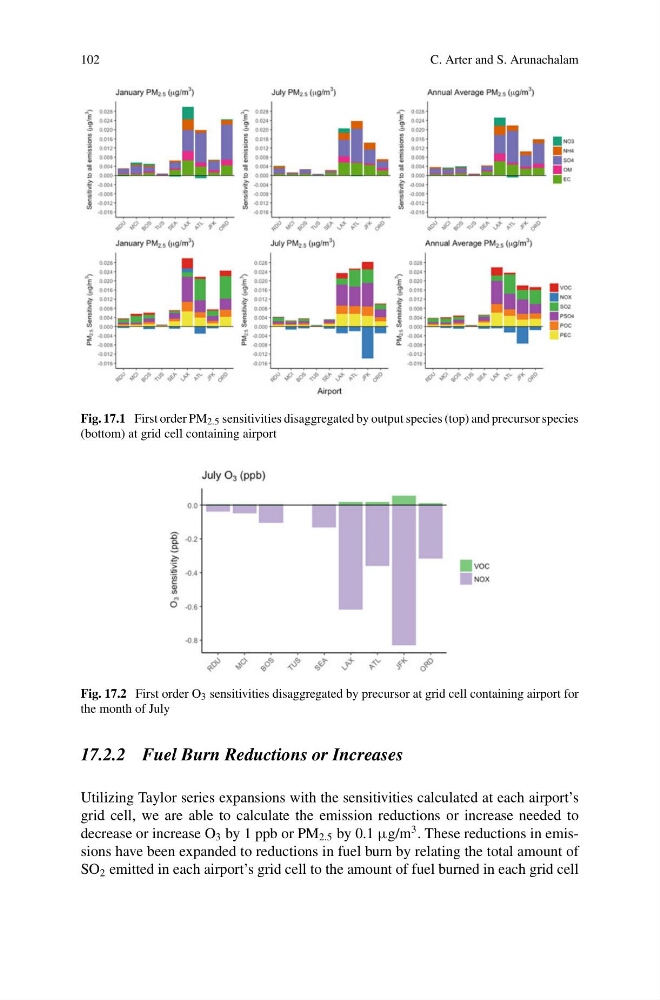
Fig. 17.1 First order PM 2.5 sensitivities disaggregated by output species (top) and precursor species
(bottom) at grid cell containing airport
Fig. 17.2 First order O 3 sensitivities disaggregated by precursor at grid cell containing airport for
the month of July
17.2.2 Fuel Burn Reductions or Increases
Utilizing Taylor series expansions with the sensitivities calculated at each airport’s
grid cell, we are able to calculate the emission reductions or increase needed to
decrease or increase O 3 by 1 ppb or PM 2.5 by 0.1 µg/m
3 . These reductions in emissions have been expanded to reductions in fuel burn by relating the total amount of
SO 2 emitted in each airport’s grid cell to the amount of fuel burned in each grid cell
C. Arter and S. Arunachalam
Fig. 17.1 First order PM 2.5 sensitivities disaggregated by output species (top) and precursor species
(bottom) at grid cell containing airport
Fig. 17.2 First order O 3 sensitivities disaggregated by precursor at grid cell containing airport for
the month of July
17.2.2 Fuel Burn Reductions or Increases
Utilizing Taylor series expansions with the sensitivities calculated at each airport’s
grid cell, we are able to calculate the emission reductions or increase needed to
decrease or increase O 3 by 1 ppb or PM 2.5 by 0.1 µg/m
3 . These reductions in emissions have been expanded to reductions in fuel burn by relating the total amount of
SO 2 emitted in each airport’s grid cell to the amount of fuel burned in each grid cell