

15 Source Localization of Ruthenium-106 Detections …
91
15.3 Results
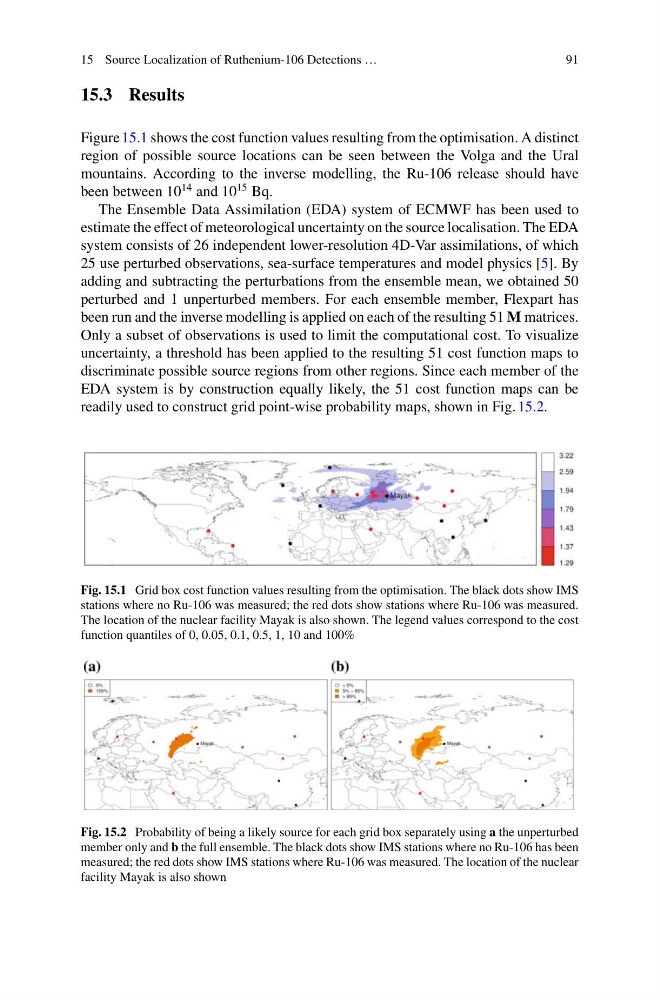
Figure 15.1 shows the cost function values resulting from the optimisation. A distinct
region of possible source locations can be seen between the Volga and the Ural
mountains. According to the inverse modelling, the Ru-106 release should have
been between 10
14 and 10
15 Bq.
The Ensemble Data Assimilation (EDA) system of ECMWF has been used to
estimate the effect of meteorological uncertainty on the source localisation. The EDA
system consists of 26 independent lower-resolution 4D-Var assimilations, of which
25 use perturbed observations, sea-surface temperatures and model physics [5]. By
adding and subtracting the perturbations from the ensemble mean, we obtained 50
perturbed and 1 unperturbed members. For each ensemble member, Flexpart has
been run and the inverse modelling is applied on each of the resulting 51 M matrices.
Only a subset of observations is used to limit the computational cost. To visualize
uncertainty, a threshold has been applied to the resulting 51 cost function maps to
discriminate possible source regions from other regions. Since each member of the
EDA system is by construction equally likely, the 51 cost function maps can be
readily used to construct grid point-wise probability maps, shown in Fig. 15.2.
Fig. 15.1 Grid box cost function values resulting from the optimisation. The black dots show IMS
stations where no Ru-106 was measured; the red dots show stations where Ru-106 was measured.
The location of the nuclear facility Mayak is also shown. The legend values correspond to the cost
function quantiles of 0, 0.05, 0.1, 0.5, 1, 10 and 100%
Fig. 15.2 Probability of being a likely source for each grid box separately using a the unperturbed
member only and b the full ensemble. The black dots show IMS stations where no Ru-106 has been
measured; the red dots show IMS stations where Ru-106 was measured. The location of the nuclear
facility Mayak is also shown
91
15.3 Results
Figure 15.1 shows the cost function values resulting from the optimisation. A distinct
region of possible source locations can be seen between the Volga and the Ural
mountains. According to the inverse modelling, the Ru-106 release should have
been between 10
14 and 10
15 Bq.
The Ensemble Data Assimilation (EDA) system of ECMWF has been used to
estimate the effect of meteorological uncertainty on the source localisation. The EDA
system consists of 26 independent lower-resolution 4D-Var assimilations, of which
25 use perturbed observations, sea-surface temperatures and model physics [5]. By
adding and subtracting the perturbations from the ensemble mean, we obtained 50
perturbed and 1 unperturbed members. For each ensemble member, Flexpart has
been run and the inverse modelling is applied on each of the resulting 51 M matrices.
Only a subset of observations is used to limit the computational cost. To visualize
uncertainty, a threshold has been applied to the resulting 51 cost function maps to
discriminate possible source regions from other regions. Since each member of the
EDA system is by construction equally likely, the 51 cost function maps can be
readily used to construct grid point-wise probability maps, shown in Fig. 15.2.
Fig. 15.1 Grid box cost function values resulting from the optimisation. The black dots show IMS
stations where no Ru-106 was measured; the red dots show stations where Ru-106 was measured.
The location of the nuclear facility Mayak is also shown. The legend values correspond to the cost
function quantiles of 0, 0.05, 0.1, 0.5, 1, 10 and 100%
Fig. 15.2 Probability of being a likely source for each grid box separately using a the unperturbed
member only and b the full ensemble. The black dots show IMS stations where no Ru-106 has been
measured; the red dots show IMS stations where Ru-106 was measured. The location of the nuclear
facility Mayak is also shown