

13 Development and Verification of a New …
79
13.3 Results and Discussion
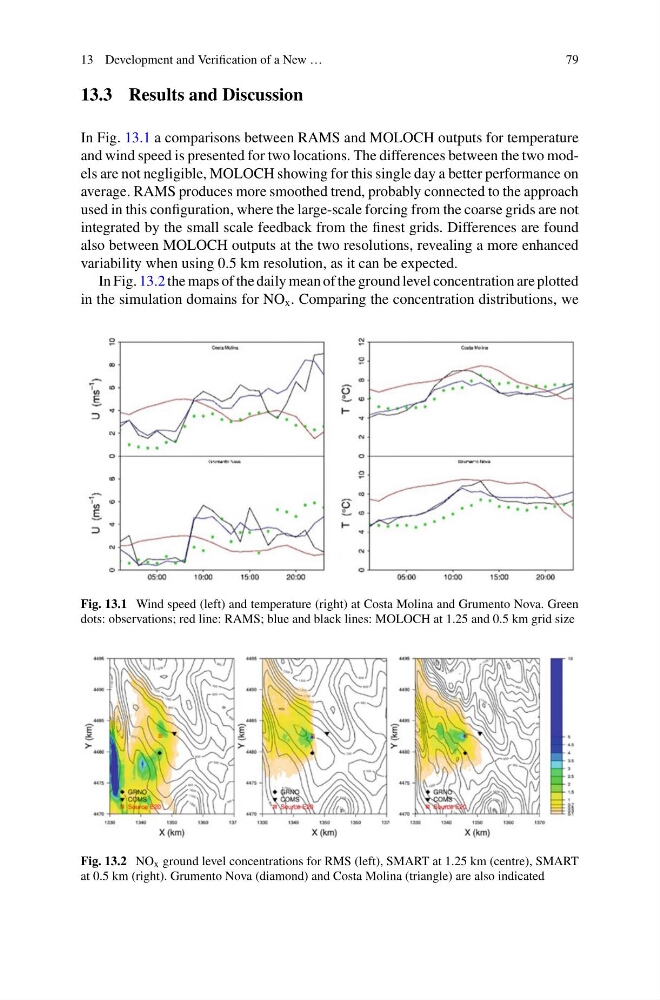
In Fig. 13.1 a comparisons between RAMS and MOLOCH outputs for temperature
and wind speed is presented for two locations. The differences between the two models are not negligible, MOLOCH showing for this single day a better performance on
average. RAMS produces more smoothed trend, probably connected to the approach
used in this configuration, where the large-scale forcing from the coarse grids are not
integrated by the small scale feedback from the finest grids. Differences are found
also between MOLOCH outputs at the two resolutions, revealing a more enhanced
variability when using 0.5 km resolution, as it can be expected.
In Fig. 13.2 the maps of the daily mean of the ground level concentration are plotted
in the simulation domains for NO x . Comparing the concentration distributions, we
Fig. 13.1 Wind speed (left) and temperature (right) at Costa Molina and Grumento Nova. Green
dots: observations; red line: RAMS; blue and black lines: MOLOCH at 1.25 and 0.5 km grid size
Fig. 13.2 NO x ground level concentrations for RMS (left), SMART at 1.25 km (centre), SMART
at 0.5 km (right). Grumento Nova (diamond) and Costa Molina (triangle) are also indicated
79
13.3 Results and Discussion
In Fig. 13.1 a comparisons between RAMS and MOLOCH outputs for temperature
and wind speed is presented for two locations. The differences between the two models are not negligible, MOLOCH showing for this single day a better performance on
average. RAMS produces more smoothed trend, probably connected to the approach
used in this configuration, where the large-scale forcing from the coarse grids are not
integrated by the small scale feedback from the finest grids. Differences are found
also between MOLOCH outputs at the two resolutions, revealing a more enhanced
variability when using 0.5 km resolution, as it can be expected.
In Fig. 13.2 the maps of the daily mean of the ground level concentration are plotted
in the simulation domains for NO x . Comparing the concentration distributions, we
Fig. 13.1 Wind speed (left) and temperature (right) at Costa Molina and Grumento Nova. Green
dots: observations; red line: RAMS; blue and black lines: MOLOCH at 1.25 and 0.5 km grid size
Fig. 13.2 NO x ground level concentrations for RMS (left), SMART at 1.25 km (centre), SMART
at 0.5 km (right). Grumento Nova (diamond) and Costa Molina (triangle) are also indicated