

12 Spatio-Temporal Monitoring and Modelling …
73
the Walloon region, 2.147 plots in the Flemish region) [1]. Based on the statistical
relationship between DBH and birch tree canopy coverage [2], the areal fraction at
each inventory site was assessed.
12.2 Results and Discussions
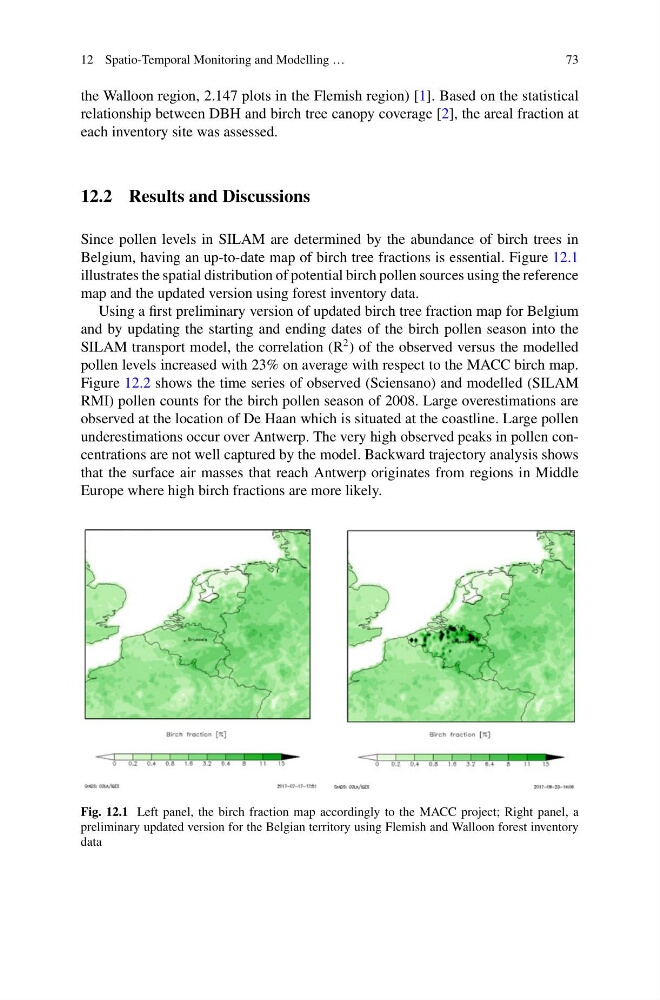
Since pollen levels in SILAM are determined by the abundance of birch trees in
Belgium, having an up-to-date map of birch tree fractions is essential. Figure 12.1
illustrates the spatial distribution of potential birch pollen sources using the reference
map and the updated version using forest inventory data.
Using a first preliminary version of updated birch tree fraction map for Belgium
and by updating the starting and ending dates of the birch pollen season into the
SILAM transport model, the correlation (R
2 ) of the observed versus the modelled
pollen levels increased with 23% on average with respect to the MACC birch map.
Figure 12.2 shows the time series of observed (Sciensano) and modelled (SILAM
RMI) pollen counts for the birch pollen season of 2008. Large overestimations are
observed at the location of De Haan which is situated at the coastline. Large pollen
underestimations occur over Antwerp. The very high observed peaks in pollen concentrations are not well captured by the model. Backward trajectory analysis shows
that the surface air masses that reach Antwerp originates from regions in Middle
Europe where high birch fractions are more likely.
Fig. 12.1 Left panel, the birch fraction map accordingly to the MACC project; Right panel, a
preliminary updated version for the Belgian territory using Flemish and Walloon forest inventory
data
73
the Walloon region, 2.147 plots in the Flemish region) [1]. Based on the statistical
relationship between DBH and birch tree canopy coverage [2], the areal fraction at
each inventory site was assessed.
12.2 Results and Discussions
Since pollen levels in SILAM are determined by the abundance of birch trees in
Belgium, having an up-to-date map of birch tree fractions is essential. Figure 12.1
illustrates the spatial distribution of potential birch pollen sources using the reference
map and the updated version using forest inventory data.
Using a first preliminary version of updated birch tree fraction map for Belgium
and by updating the starting and ending dates of the birch pollen season into the
SILAM transport model, the correlation (R
2 ) of the observed versus the modelled
pollen levels increased with 23% on average with respect to the MACC birch map.
Figure 12.2 shows the time series of observed (Sciensano) and modelled (SILAM
RMI) pollen counts for the birch pollen season of 2008. Large overestimations are
observed at the location of De Haan which is situated at the coastline. Large pollen
underestimations occur over Antwerp. The very high observed peaks in pollen concentrations are not well captured by the model. Backward trajectory analysis shows
that the surface air masses that reach Antwerp originates from regions in Middle
Europe where high birch fractions are more likely.
Fig. 12.1 Left panel, the birch fraction map accordingly to the MACC project; Right panel, a
preliminary updated version for the Belgian territory using Flemish and Walloon forest inventory
data