

68
R. Kouznetsov et al.
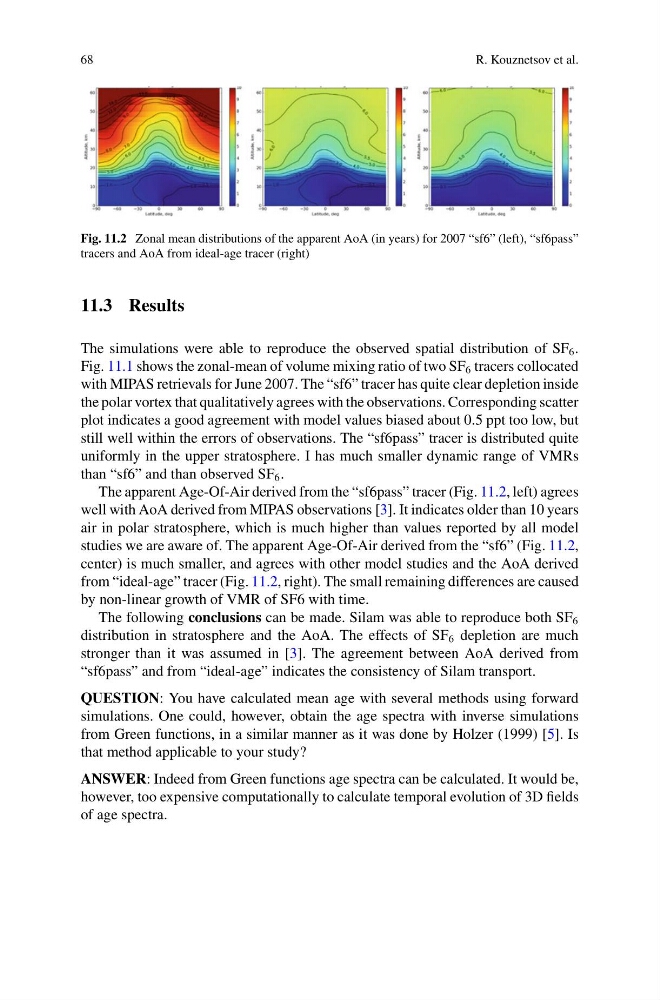
Fig. 11.2 Zonal mean distributions of the apparent AoA (in years) for 2007 “sf6” (left), “sf6pass”
tracers and AoA from ideal-age tracer (right)
11.3 Results
The simulations were able to reproduce the observed spatial distribution of SF 6 .
Fig. 11.1 shows the zonal-mean of volume mixing ratio of two SF 6 tracers collocated
with MIPAS retrievals for June 2007. The “sf6” tracer has quite clear depletion inside
the polar vortex that qualitatively agrees with the observations. Corresponding scatter
plot indicates a good agreement with model values biased about 0.5 ppt too low, but
still well within the errors of observations. The “sf6pass” tracer is distributed quite
uniformly in the upper stratosphere. I has much smaller dynamic range of VMRs
than “sf6” and than observed SF 6 .
The apparent Age-Of-Air derived from the “sf6pass” tracer (Fig. 11.2, left) agrees
well with AoA derived from MIPAS observations [3]. It indicates older than 10 years
air in polar stratosphere, which is much higher than values reported by all model
studies we are aware of. The apparent Age-Of-Air derived from the “sf6” (Fig. 11.2,
center) is much smaller, and agrees with other model studies and the AoA derived
from “ideal-age” tracer (Fig. 11.2, right). The small remaining differences are caused
by non-linear growth of VMR of SF6 with time.
The following conclusions can be made. Silam was able to reproduce both SF 6
distribution in stratosphere and the AoA. The effects of SF 6 depletion are much
stronger than it was assumed in [3]. The agreement between AoA derived from
“sf6pass” and from “ideal-age” indicates the consistency of Silam transport.
QUESTION: You have calculated mean age with several methods using forward
simulations. One could, however, obtain the age spectra with inverse simulations
from Green functions, in a similar manner as it was done by Holzer (1999) [5]. Is
that method applicable to your study?
ANSWER: Indeed from Green functions age spectra can be calculated. It would be,
however, too expensive computationally to calculate temporal evolution of 3D fields
of age spectra.
R. Kouznetsov et al.
Fig. 11.2 Zonal mean distributions of the apparent AoA (in years) for 2007 “sf6” (left), “sf6pass”
tracers and AoA from ideal-age tracer (right)
11.3 Results
The simulations were able to reproduce the observed spatial distribution of SF 6 .
Fig. 11.1 shows the zonal-mean of volume mixing ratio of two SF 6 tracers collocated
with MIPAS retrievals for June 2007. The “sf6” tracer has quite clear depletion inside
the polar vortex that qualitatively agrees with the observations. Corresponding scatter
plot indicates a good agreement with model values biased about 0.5 ppt too low, but
still well within the errors of observations. The “sf6pass” tracer is distributed quite
uniformly in the upper stratosphere. I has much smaller dynamic range of VMRs
than “sf6” and than observed SF 6 .
The apparent Age-Of-Air derived from the “sf6pass” tracer (Fig. 11.2, left) agrees
well with AoA derived from MIPAS observations [3]. It indicates older than 10 years
air in polar stratosphere, which is much higher than values reported by all model
studies we are aware of. The apparent Age-Of-Air derived from the “sf6” (Fig. 11.2,
center) is much smaller, and agrees with other model studies and the AoA derived
from “ideal-age” tracer (Fig. 11.2, right). The small remaining differences are caused
by non-linear growth of VMR of SF6 with time.
The following conclusions can be made. Silam was able to reproduce both SF 6
distribution in stratosphere and the AoA. The effects of SF 6 depletion are much
stronger than it was assumed in [3]. The agreement between AoA derived from
“sf6pass” and from “ideal-age” indicates the consistency of Silam transport.
QUESTION: You have calculated mean age with several methods using forward
simulations. One could, however, obtain the age spectra with inverse simulations
from Green functions, in a similar manner as it was done by Holzer (1999) [5]. Is
that method applicable to your study?
ANSWER: Indeed from Green functions age spectra can be calculated. It would be,
however, too expensive computationally to calculate temporal evolution of 3D fields
of age spectra.