

11 Stratospheric Age-Of-Air and SF6 Simulations with Silam
67
“sf6pass” tracer
MIPAS SF6 VMR, ppt
“sf6” tracer
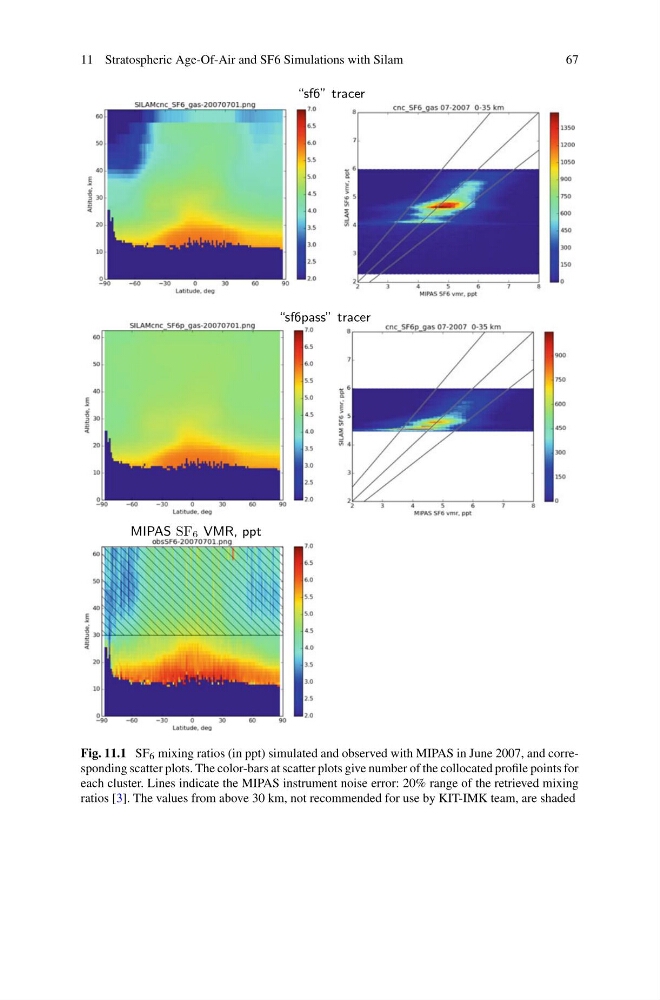
Fig. 11.1 SF 6 mixing ratios (in ppt) simulated and observed with MIPAS in June 2007, and corresponding scatter plots. The color-bars at scatter plots give number of the collocated profile points for
each cluster. Lines indicate the MIPAS instrument noise error: 20% range of the retrieved mixing
ratios [3]. The values from above 30 km, not recommended for use by KIT-IMK team, are shaded
67
“sf6pass” tracer
MIPAS SF6 VMR, ppt
“sf6” tracer
Fig. 11.1 SF 6 mixing ratios (in ppt) simulated and observed with MIPAS in June 2007, and corresponding scatter plots. The color-bars at scatter plots give number of the collocated profile points for
each cluster. Lines indicate the MIPAS instrument noise error: 20% range of the retrieved mixing
ratios [3]. The values from above 30 km, not recommended for use by KIT-IMK team, are shaded