

62
A. Dore et al.
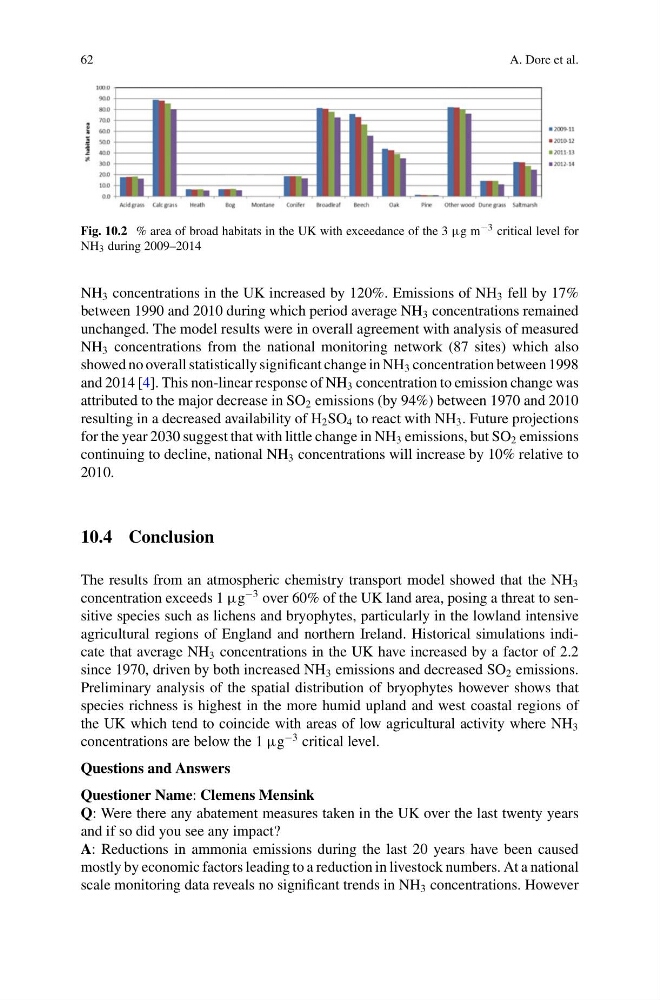
Fig. 10.2 % area of broad habitats in the UK with exceedance of the 3 µg m −3 critical level for
NH 3 during 2009–2014
NH 3 concentrations in the UK increased by 120%. Emissions of NH 3 fell by 17%
between 1990 and 2010 during which period average NH 3 concentrations remained
unchanged. The model results were in overall agreement with analysis of measured
NH 3 concentrations from the national monitoring network (87 sites) which also
showed no overall statistically significant change in NH 3 concentration between 1998
and 2014 [4]. This non-linear response of NH 3 concentration to emission change was
attributed to the major decrease in SO 2 emissions (by 94%) between 1970 and 2010
resulting in a decreased availability of H 2 SO 4 to react with NH 3 . Future projections
for the year 2030 suggest that with little change in NH 3 emissions, but SO 2 emissions
continuing to decline, national NH 3 concentrations will increase by 10% relative to
2010.
10.4 Conclusion
The results from an atmospheric chemistry transport model showed that the NH 3
concentration exceeds 1 µg
−3 over 60% of the UK land area, posing a threat to sensitive species such as lichens and bryophytes, particularly in the lowland intensive
agricultural regions of England and northern Ireland. Historical simulations indicate that average NH 3 concentrations in the UK have increased by a factor of 2.2
since 1970, driven by both increased NH 3 emissions and decreased SO 2 emissions.
Preliminary analysis of the spatial distribution of bryophytes however shows that
species richness is highest in the more humid upland and west coastal regions of
the UK which tend to coincide with areas of low agricultural activity where NH 3
concentrations are below the 1 µg
−3 critical level.
Questions and Answers
Questioner Name: Clemens Mensink
Q: Were there any abatement measures taken in the UK over the last twenty years
and if so did you see any impact?
A: Reductions in ammonia emissions during the last 20 years have been caused
mostly by economic factors leading to a reduction in livestock numbers. At a national
scale monitoring data reveals no significant trends in NH 3 concentrations. However
A. Dore et al.
Fig. 10.2 % area of broad habitats in the UK with exceedance of the 3 µg m −3 critical level for
NH 3 during 2009–2014
NH 3 concentrations in the UK increased by 120%. Emissions of NH 3 fell by 17%
between 1990 and 2010 during which period average NH 3 concentrations remained
unchanged. The model results were in overall agreement with analysis of measured
NH 3 concentrations from the national monitoring network (87 sites) which also
showed no overall statistically significant change in NH 3 concentration between 1998
and 2014 [4]. This non-linear response of NH 3 concentration to emission change was
attributed to the major decrease in SO 2 emissions (by 94%) between 1970 and 2010
resulting in a decreased availability of H 2 SO 4 to react with NH 3 . Future projections
for the year 2030 suggest that with little change in NH 3 emissions, but SO 2 emissions
continuing to decline, national NH 3 concentrations will increase by 10% relative to
2010.
10.4 Conclusion
The results from an atmospheric chemistry transport model showed that the NH 3
concentration exceeds 1 µg
−3 over 60% of the UK land area, posing a threat to sensitive species such as lichens and bryophytes, particularly in the lowland intensive
agricultural regions of England and northern Ireland. Historical simulations indicate that average NH 3 concentrations in the UK have increased by a factor of 2.2
since 1970, driven by both increased NH 3 emissions and decreased SO 2 emissions.
Preliminary analysis of the spatial distribution of bryophytes however shows that
species richness is highest in the more humid upland and west coastal regions of
the UK which tend to coincide with areas of low agricultural activity where NH 3
concentrations are below the 1 µg
−3 critical level.
Questions and Answers
Questioner Name: Clemens Mensink
Q: Were there any abatement measures taken in the UK over the last twenty years
and if so did you see any impact?
A: Reductions in ammonia emissions during the last 20 years have been caused
mostly by economic factors leading to a reduction in livestock numbers. At a national
scale monitoring data reveals no significant trends in NH 3 concentrations. However