

10 Modelling the Concentration of Ammonia and Exceedance …
61
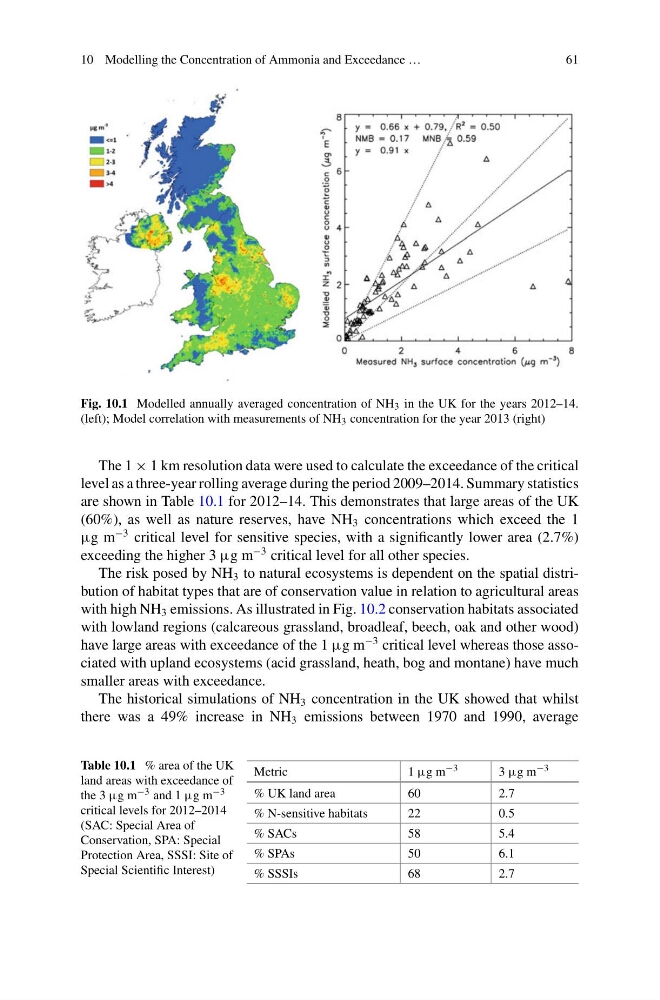
Fig. 10.1 Modelled annually averaged concentration of NH 3 in the UK for the years 2012–14.
(left); Model correlation with measurements of NH 3 concentration for the year 2013 (right)
The 1 × 1 km resolution data were used to calculate the exceedance of the critical
level as a three-year rolling average during the period 2009–2014. Summary statistics
are shown in Table 10.1 for 2012–14. This demonstrates that large areas of the UK
(60%), as well as nature reserves, have NH 3 concentrations which exceed the 1
µg m
−3 critical level for sensitive species, with a significantly lower area (2.7%)
exceeding the higher 3 µg m
−3 critical level for all other species.
The risk posed by NH 3 to natural ecosystems is dependent on the spatial distribution of habitat types that are of conservation value in relation to agricultural areas
with high NH 3 emissions. As illustrated in Fig. 10.2 conservation habitats associated
with lowland regions (calcareous grassland, broadleaf, beech, oak and other wood)
have large areas with exceedance of the 1 µg m
−3 critical level whereas those associated with upland ecosystems (acid grassland, heath, bog and montane) have much
smaller areas with exceedance.
The historical simulations of NH 3 concentration in the UK showed that whilst
there was a 49% increase in NH 3 emissions between 1970 and 1990, average
Table 10.1 % area of the UK
land areas with exceedance of
the 3 µg m −3 and 1 µg m −3
critical levels for 2012–2014
(SAC: Special Area of
Conservation, SPA: Special
Protection Area, SSSI: Site of
Special Scientific Interest)
Metric
1 µg m −3
3 µg m −3
% UK land area
60
2.7
% N-sensitive habitats
22
0.5
% SACs
58
5.4
% SPAs
50
6.1
% SSSIs
68
2.7
61
Fig. 10.1 Modelled annually averaged concentration of NH 3 in the UK for the years 2012–14.
(left); Model correlation with measurements of NH 3 concentration for the year 2013 (right)
The 1 × 1 km resolution data were used to calculate the exceedance of the critical
level as a three-year rolling average during the period 2009–2014. Summary statistics
are shown in Table 10.1 for 2012–14. This demonstrates that large areas of the UK
(60%), as well as nature reserves, have NH 3 concentrations which exceed the 1
µg m
−3 critical level for sensitive species, with a significantly lower area (2.7%)
exceeding the higher 3 µg m
−3 critical level for all other species.
The risk posed by NH 3 to natural ecosystems is dependent on the spatial distribution of habitat types that are of conservation value in relation to agricultural areas
with high NH 3 emissions. As illustrated in Fig. 10.2 conservation habitats associated
with lowland regions (calcareous grassland, broadleaf, beech, oak and other wood)
have large areas with exceedance of the 1 µg m
−3 critical level whereas those associated with upland ecosystems (acid grassland, heath, bog and montane) have much
smaller areas with exceedance.
The historical simulations of NH 3 concentration in the UK showed that whilst
there was a 49% increase in NH 3 emissions between 1970 and 1990, average
Table 10.1 % area of the UK
land areas with exceedance of
the 3 µg m −3 and 1 µg m −3
critical levels for 2012–2014
(SAC: Special Area of
Conservation, SPA: Special
Protection Area, SSSI: Site of
Special Scientific Interest)
Metric
1 µg m −3
3 µg m −3
% UK land area
60
2.7
% N-sensitive habitats
22
0.5
% SACs
58
5.4
% SPAs
50
6.1
% SSSIs
68
2.7