

366
27 Non-elastic Uniaxial Elongation–Compression
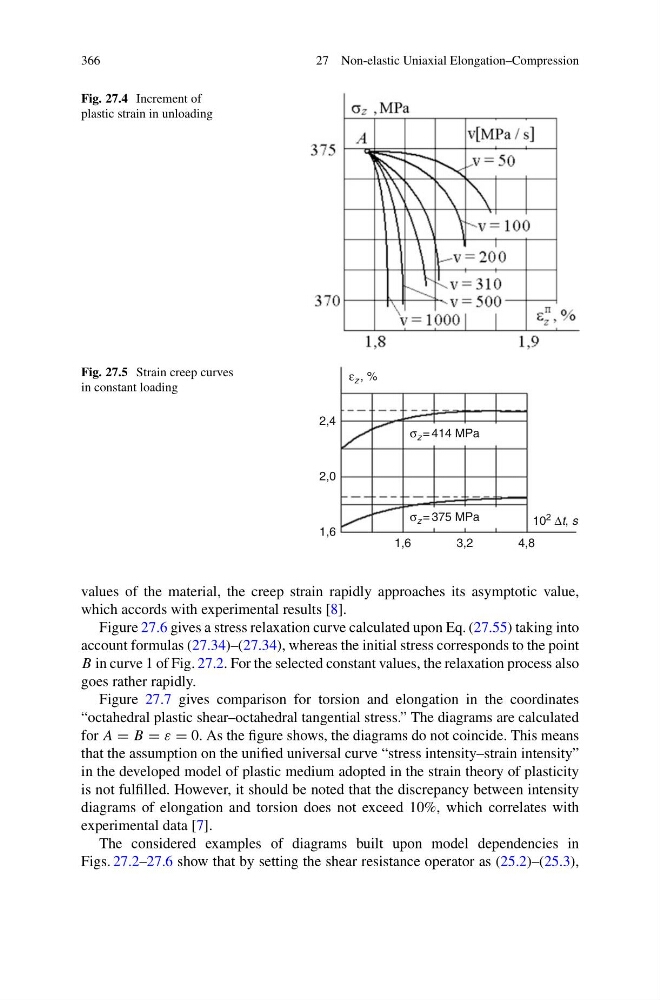
Fig. 27.4 Increment of
plastic strain in unloading
Fig. 27.5 Strain creep curves
in constant loading
1,6
1,6
3,2
4,8
10
2 Δt, s
σ z = 375 MPa
σ z = 414 MPa
2,0
2,4
ε z , %
values of the material, the creep strain rapidly approaches its asymptotic value,
which accords with experimental results [8].
Figure 27.6 gives a stress relaxation curve calculated upon Eq. (27.55) taking into
account formulas (27.34)–(27.34), whereas the initial stress corresponds to the point
B in curve 1 of Fig. 27.2. For the selected constant values, the relaxation process also
goes rather rapidly.
Figure 27.7 gives comparison for torsion and elongation in the coordinates
“octahedral plastic shear–octahedral tangential stress.” The diagrams are calculated
for A = B = ε = 0. As the figure shows, the diagrams do not coincide. This means
that the assumption on the unified universal curve “stress intensity–strain intensity”
in the developed model of plastic medium adopted in the strain theory of plasticity
is not fulfilled. However, it should be noted that the discrepancy between intensity
diagrams of elongation and torsion does not exceed 10%, which correlates with
experimental data [7].
The considered examples of diagrams built upon model dependencies in
Figs. 27.2–27.6 show that by setting the shear resistance operator as (25.2)–(25.3),
27 Non-elastic Uniaxial Elongation–Compression
Fig. 27.4 Increment of
plastic strain in unloading
Fig. 27.5 Strain creep curves
in constant loading
1,6
1,6
3,2
4,8
10
2 Δt, s
σ z = 375 MPa
σ z = 414 MPa
2,0
2,4
ε z , %
values of the material, the creep strain rapidly approaches its asymptotic value,
which accords with experimental results [8].
Figure 27.6 gives a stress relaxation curve calculated upon Eq. (27.55) taking into
account formulas (27.34)–(27.34), whereas the initial stress corresponds to the point
B in curve 1 of Fig. 27.2. For the selected constant values, the relaxation process also
goes rather rapidly.
Figure 27.7 gives comparison for torsion and elongation in the coordinates
“octahedral plastic shear–octahedral tangential stress.” The diagrams are calculated
for A = B = ε = 0. As the figure shows, the diagrams do not coincide. This means
that the assumption on the unified universal curve “stress intensity–strain intensity”
in the developed model of plastic medium adopted in the strain theory of plasticity
is not fulfilled. However, it should be noted that the discrepancy between intensity
diagrams of elongation and torsion does not exceed 10%, which correlates with
experimental data [7].
The considered examples of diagrams built upon model dependencies in
Figs. 27.2–27.6 show that by setting the shear resistance operator as (25.2)–(25.3),