

364
27 Non-elastic Uniaxial Elongation–Compression
27.8 Examples of Building Diagrams in an Uniaxial Stressed
State
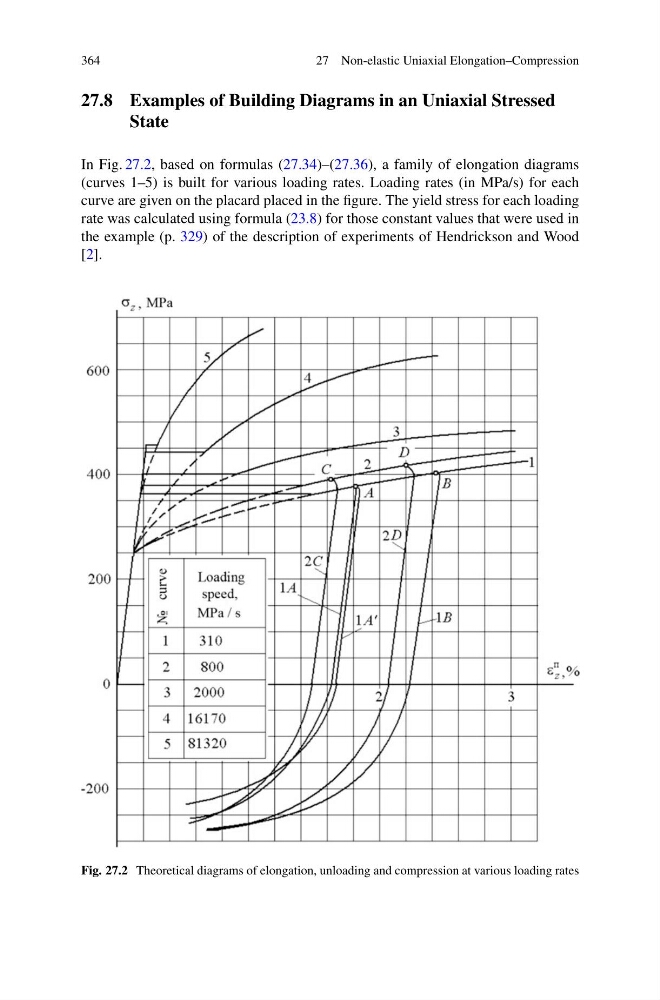
In Fig. 27.2, based on formulas (27.34)–(27.36), a family of elongation diagrams
(curves 1–5) is built for various loading rates. Loading rates (in MPa/s) for each
curve are given on the placard placed in the figure. The yield stress for each loading
rate was calculated using formula (23.8) for those constant values that were used in
the example (p. 329) of the description of experiments of Hendrickson and Wood
[2].
Fig. 27.2 Theoretical diagrams of elongation, unloading and compression at various loading rates
27 Non-elastic Uniaxial Elongation–Compression
27.8 Examples of Building Diagrams in an Uniaxial Stressed
State
In Fig. 27.2, based on formulas (27.34)–(27.36), a family of elongation diagrams
(curves 1–5) is built for various loading rates. Loading rates (in MPa/s) for each
curve are given on the placard placed in the figure. The yield stress for each loading
rate was calculated using formula (23.8) for those constant values that were used in
the example (p. 329) of the description of experiments of Hendrickson and Wood
[2].
Fig. 27.2 Theoretical diagrams of elongation, unloading and compression at various loading rates