

15.2 Defining the Universal Hardening Function
197
similarity with the experiment, but in others they could not be deemed even rough
approximation to reality.
15.2 Defining the Universal Hardening Function
For the experimental definition of the universal hardening function σ i = i ), we
can use an experiment for thin-wall tube twisting (p. 188). We use this experiment
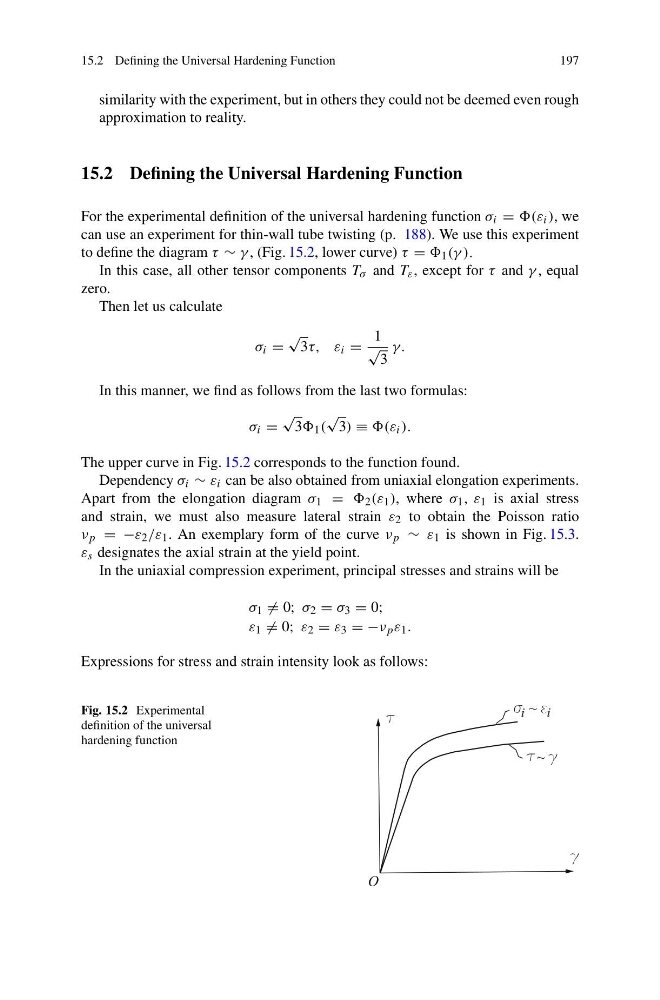
to define the diagram τ ∼ γ , (Fig. 15.2, lower curve) τ = 1 (γ ).
In this case, all other tensor components T σ and T ε , except for τ and γ , equal
zero.
Then let us calculate
σ i =
√
3τ, ε i =
1
√
3
γ.
In this manner, we find as follows from the last two formulas:
σ i =
√
3 1 (
√
3) ≡ i ).
The upper curve in Fig. 15.2 corresponds to the function found.
Dependency σ i ∼ ε i can be also obtained from uniaxial elongation experiments.
Apart from the elongation diagram σ 1 = 2 (ε 1 ), where σ 1 , ε 1 is axial stress
and strain, we must also measure lateral strain ε 2 to obtain the Poisson ratio
ν p = −ε 2 /ε 1 . An exemplary form of the curve ν p ∼ ε 1 is shown in Fig. 15.3.
ε s designates the axial strain at the yield point.
In the uniaxial compression experiment, principal stresses and strains will be
σ 1 = 0; σ 2 = σ 3 = 0;
ε 1 = 0; ε 2 = ε 3 = −ν p ε 1 .
Expressions for stress and strain intensity look as follows:
Fig. 15.2 Experimental
definition of the universal
hardening function
197
similarity with the experiment, but in others they could not be deemed even rough
approximation to reality.
15.2 Defining the Universal Hardening Function
For the experimental definition of the universal hardening function σ i = i ), we
can use an experiment for thin-wall tube twisting (p. 188). We use this experiment
to define the diagram τ ∼ γ , (Fig. 15.2, lower curve) τ = 1 (γ ).
In this case, all other tensor components T σ and T ε , except for τ and γ , equal
zero.
Then let us calculate
σ i =
√
3τ, ε i =
1
√
3
γ.
In this manner, we find as follows from the last two formulas:
σ i =
√
3 1 (
√
3) ≡ i ).
The upper curve in Fig. 15.2 corresponds to the function found.
Dependency σ i ∼ ε i can be also obtained from uniaxial elongation experiments.
Apart from the elongation diagram σ 1 = 2 (ε 1 ), where σ 1 , ε 1 is axial stress
and strain, we must also measure lateral strain ε 2 to obtain the Poisson ratio
ν p = −ε 2 /ε 1 . An exemplary form of the curve ν p ∼ ε 1 is shown in Fig. 15.3.
ε s designates the axial strain at the yield point.
In the uniaxial compression experiment, principal stresses and strains will be
σ 1 = 0; σ 2 = σ 3 = 0;
ε 1 = 0; ε 2 = ε 3 = −ν p ε 1 .
Expressions for stress and strain intensity look as follows:
Fig. 15.2 Experimental
definition of the universal
hardening function