

178
13 Initial Concepts of Plasticity Theory
The diagram may have all points corresponding to the proportionality limit σ ? ,
elastic limit σ y , and yield point σ s . All the three characteristics are not absolute
and have a relative sense because their values substantially depend on measurement
accuracy, micro-damages of the material structure, accuracy tolerance for the
geometric size of the sample, and other factors. The ultimate strength σ ? is more
stable in elongation experiments due to a higher certainty of the position of the
point N on the stress diagram.
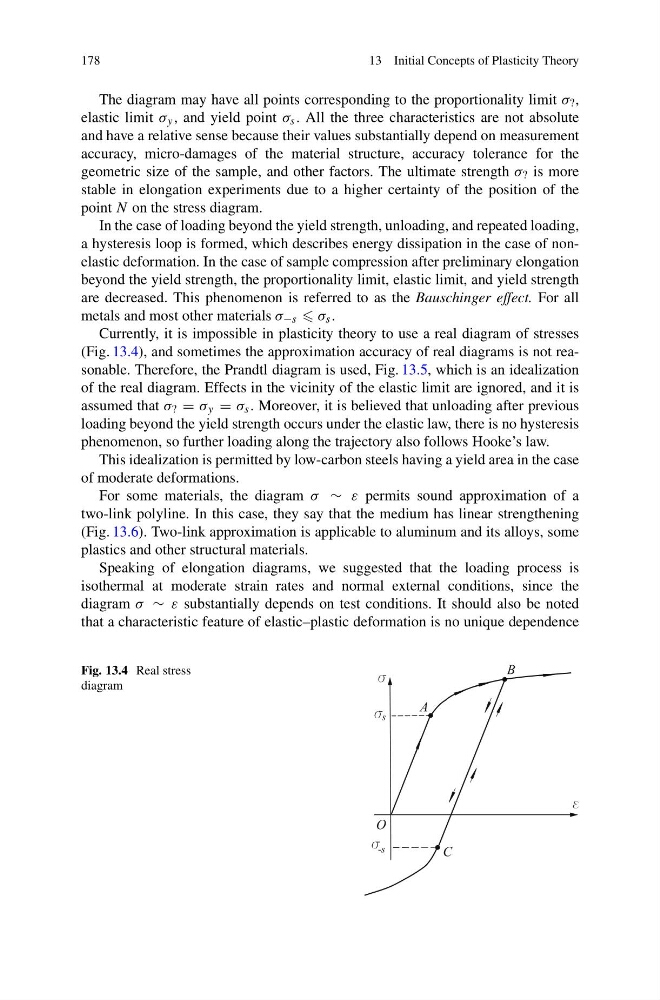
In the case of loading beyond the yield strength, unloading, and repeated loading,
a hysteresis loop is formed, which describes energy dissipation in the case of nonelastic deformation. In the case of sample compression after preliminary elongation
beyond the yield strength, the proportionality limit, elastic limit, and yield strength
are decreased. This phenomenon is referred to as the Bauschinger effect. For all
metals and most other materials σ −s σ s .
Currently, it is impossible in plasticity theory to use a real diagram of stresses
(Fig. 13.4), and sometimes the approximation accuracy of real diagrams is not reasonable. Therefore, the Prandtl diagram is used, Fig. 13.5, which is an idealization
of the real diagram. Effects in the vicinity of the elastic limit are ignored, and it is
assumed that σ ? = σ y = σ s . Moreover, it is believed that unloading after previous
loading beyond the yield strength occurs under the elastic law, there is no hysteresis
phenomenon, so further loading along the trajectory also follows Hooke’s law.
This idealization is permitted by low-carbon steels having a yield area in the case
of moderate deformations.
For some materials, the diagram σ ∼ ε permits sound approximation of a
two-link polyline. In this case, they say that the medium has linear strengthening
(Fig. 13.6). Two-link approximation is applicable to aluminum and its alloys, some
plastics and other structural materials.
Speaking of elongation diagrams, we suggested that the loading process is
isothermal at moderate strain rates and normal external conditions, since the
diagram σ ∼ ε substantially depends on test conditions. It should also be noted
that a characteristic feature of elastic–plastic deformation is no unique dependence
Fig. 13.4 Real stress
diagram
13 Initial Concepts of Plasticity Theory
The diagram may have all points corresponding to the proportionality limit σ ? ,
elastic limit σ y , and yield point σ s . All the three characteristics are not absolute
and have a relative sense because their values substantially depend on measurement
accuracy, micro-damages of the material structure, accuracy tolerance for the
geometric size of the sample, and other factors. The ultimate strength σ ? is more
stable in elongation experiments due to a higher certainty of the position of the
point N on the stress diagram.
In the case of loading beyond the yield strength, unloading, and repeated loading,
a hysteresis loop is formed, which describes energy dissipation in the case of nonelastic deformation. In the case of sample compression after preliminary elongation
beyond the yield strength, the proportionality limit, elastic limit, and yield strength
are decreased. This phenomenon is referred to as the Bauschinger effect. For all
metals and most other materials σ −s σ s .
Currently, it is impossible in plasticity theory to use a real diagram of stresses
(Fig. 13.4), and sometimes the approximation accuracy of real diagrams is not reasonable. Therefore, the Prandtl diagram is used, Fig. 13.5, which is an idealization
of the real diagram. Effects in the vicinity of the elastic limit are ignored, and it is
assumed that σ ? = σ y = σ s . Moreover, it is believed that unloading after previous
loading beyond the yield strength occurs under the elastic law, there is no hysteresis
phenomenon, so further loading along the trajectory also follows Hooke’s law.
This idealization is permitted by low-carbon steels having a yield area in the case
of moderate deformations.
For some materials, the diagram σ ∼ ε permits sound approximation of a
two-link polyline. In this case, they say that the medium has linear strengthening
(Fig. 13.6). Two-link approximation is applicable to aluminum and its alloys, some
plastics and other structural materials.
Speaking of elongation diagrams, we suggested that the loading process is
isothermal at moderate strain rates and normal external conditions, since the
diagram σ ∼ ε substantially depends on test conditions. It should also be noted
that a characteristic feature of elastic–plastic deformation is no unique dependence
Fig. 13.4 Real stress
diagram