

10.6 Somigliana Dislocation in Half-Plane
115
a
b
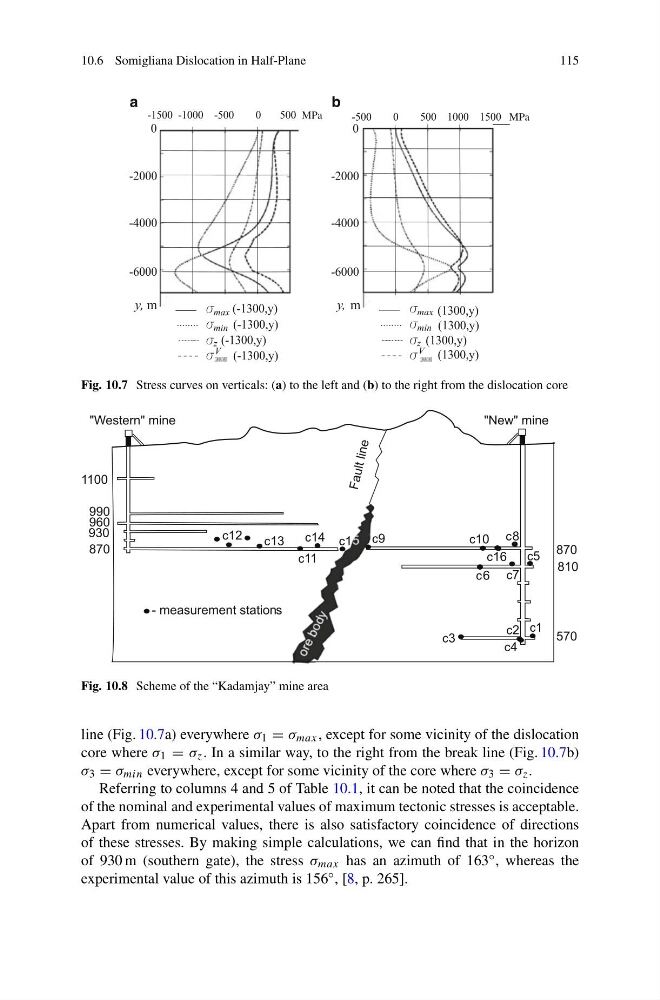
Fig. 10.7 Stress curves on verticals: (a) to the left and (b) to the right from the dislocation core
c
c
c
c
c
c
c
c
c
c
c
c
c
c
c
c
Fig. 10.8 Scheme of the “Kadamjay” mine area
line (Fig. 10.7a) everywhere σ 1 = σ max , except for some vicinity of the dislocation
core where σ 1 = σ z . In a similar way, to the right from the break line (Fig. 10.7b)
σ 3 = σ min everywhere, except for some vicinity of the core where σ 3 = σ z .
Referring to columns 4 and 5 of Table 10.1, it can be noted that the coincidence
of the nominal and experimental values of maximum tectonic stresses is acceptable.
Apart from numerical values, there is also satisfactory coincidence of directions
of these stresses. By making simple calculations, we can find that in the horizon
of 930 m (southern gate), the stress σ max has an azimuth of 163 ◦ , whereas the
experimental value of this azimuth is 156 ◦ , [8, p. 265].
115
a
b
Fig. 10.7 Stress curves on verticals: (a) to the left and (b) to the right from the dislocation core
c
c
c
c
c
c
c
c
c
c
c
c
c
c
c
c
Fig. 10.8 Scheme of the “Kadamjay” mine area
line (Fig. 10.7a) everywhere σ 1 = σ max , except for some vicinity of the dislocation
core where σ 1 = σ z . In a similar way, to the right from the break line (Fig. 10.7b)
σ 3 = σ min everywhere, except for some vicinity of the core where σ 3 = σ z .
Referring to columns 4 and 5 of Table 10.1, it can be noted that the coincidence
of the nominal and experimental values of maximum tectonic stresses is acceptable.
Apart from numerical values, there is also satisfactory coincidence of directions
of these stresses. By making simple calculations, we can find that in the horizon
of 930 m (southern gate), the stress σ max has an azimuth of 163 ◦ , whereas the
experimental value of this azimuth is 156 ◦ , [8, p. 265].