

114
10 Mathematical Structural Imperfections
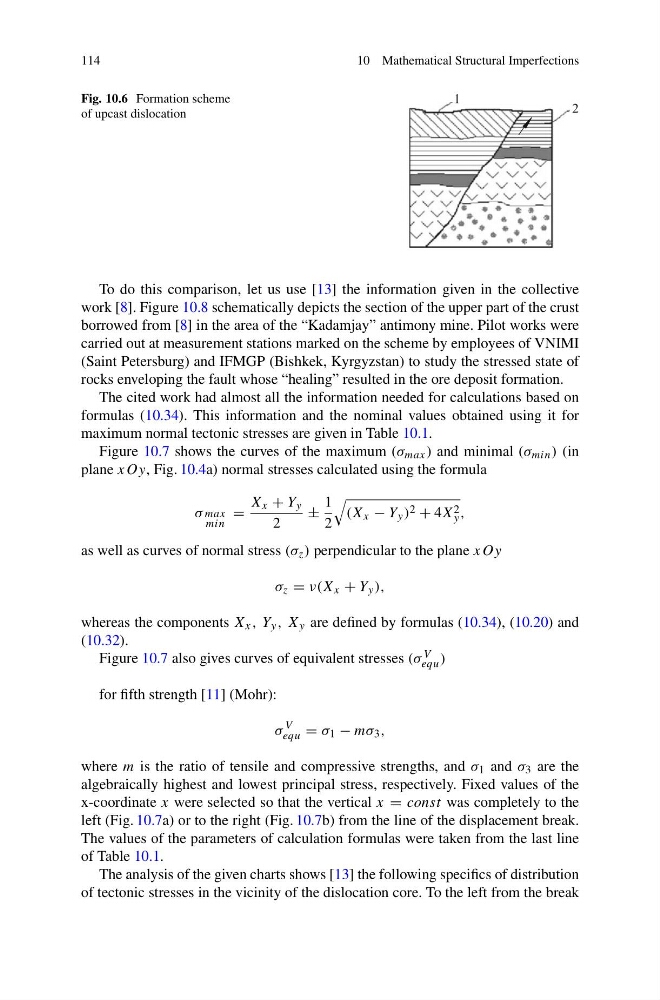
Fig. 10.6 Formation scheme
of upcast dislocation
To do this comparison, let us use [13] the information given in the collective
work [8]. Figure 10.8 schematically depicts the section of the upper part of the crust
borrowed from [8] in the area of the “Kadamjay” antimony mine. Pilot works were
carried out at measurement stations marked on the scheme by employees of VNIMI
(Saint Petersburg) and IFMGP (Bishkek, Kyrgyzstan) to study the stressed state of
rocks enveloping the fault whose “healing” resulted in the ore deposit formation.
The cited work had almost all the information needed for calculations based on
formulas (10.34). This information and the nominal values obtained using it for
maximum normal tectonic stresses are given in Table 10.1.
Figure 10.7 shows the curves of the maximum (σ max ) and minimal (σ min ) (in
plane xOy, Fig. 10.4a) normal stresses calculated using the formula
σ max
min
=
X x + Y y
2
±
1
2
(X x − Y y ) 2 + 4X 2
y ,
as well as curves of normal stress (σ z ) perpendicular to the plane xOy
σ z = ν(X x + Y y ),
whereas the components X x , Y y , X y are defined by formulas (10.34), (10.20) and
(10.32).
Figure 10.7 also gives curves of equivalent stresses (σ V
equ )
for fifth strength [11] (Mohr):
σ
V
equ = σ 1 − mσ 3 ,
where m is the ratio of tensile and compressive strengths, and σ 1 and σ 3 are the
algebraically highest and lowest principal stress, respectively. Fixed values of the
x-coordinate x were selected so that the vertical x = const was completely to the
left (Fig. 10.7a) or to the right (Fig. 10.7b) from the line of the displacement break.
The values of the parameters of calculation formulas were taken from the last line
of Table 10.1.
The analysis of the given charts shows [13] the following specifics of distribution
of tectonic stresses in the vicinity of the dislocation core. To the left from the break
10 Mathematical Structural Imperfections
Fig. 10.6 Formation scheme
of upcast dislocation
To do this comparison, let us use [13] the information given in the collective
work [8]. Figure 10.8 schematically depicts the section of the upper part of the crust
borrowed from [8] in the area of the “Kadamjay” antimony mine. Pilot works were
carried out at measurement stations marked on the scheme by employees of VNIMI
(Saint Petersburg) and IFMGP (Bishkek, Kyrgyzstan) to study the stressed state of
rocks enveloping the fault whose “healing” resulted in the ore deposit formation.
The cited work had almost all the information needed for calculations based on
formulas (10.34). This information and the nominal values obtained using it for
maximum normal tectonic stresses are given in Table 10.1.
Figure 10.7 shows the curves of the maximum (σ max ) and minimal (σ min ) (in
plane xOy, Fig. 10.4a) normal stresses calculated using the formula
σ max
min
=
X x + Y y
2
±
1
2
(X x − Y y ) 2 + 4X 2
y ,
as well as curves of normal stress (σ z ) perpendicular to the plane xOy
σ z = ν(X x + Y y ),
whereas the components X x , Y y , X y are defined by formulas (10.34), (10.20) and
(10.32).
Figure 10.7 also gives curves of equivalent stresses (σ V
equ )
for fifth strength [11] (Mohr):
σ
V
equ = σ 1 − mσ 3 ,
where m is the ratio of tensile and compressive strengths, and σ 1 and σ 3 are the
algebraically highest and lowest principal stress, respectively. Fixed values of the
x-coordinate x were selected so that the vertical x = const was completely to the
left (Fig. 10.7a) or to the right (Fig. 10.7b) from the line of the displacement break.
The values of the parameters of calculation formulas were taken from the last line
of Table 10.1.
The analysis of the given charts shows [13] the following specifics of distribution
of tectonic stresses in the vicinity of the dislocation core. To the left from the break