

24 3D Object Classification, Visual Search …
371
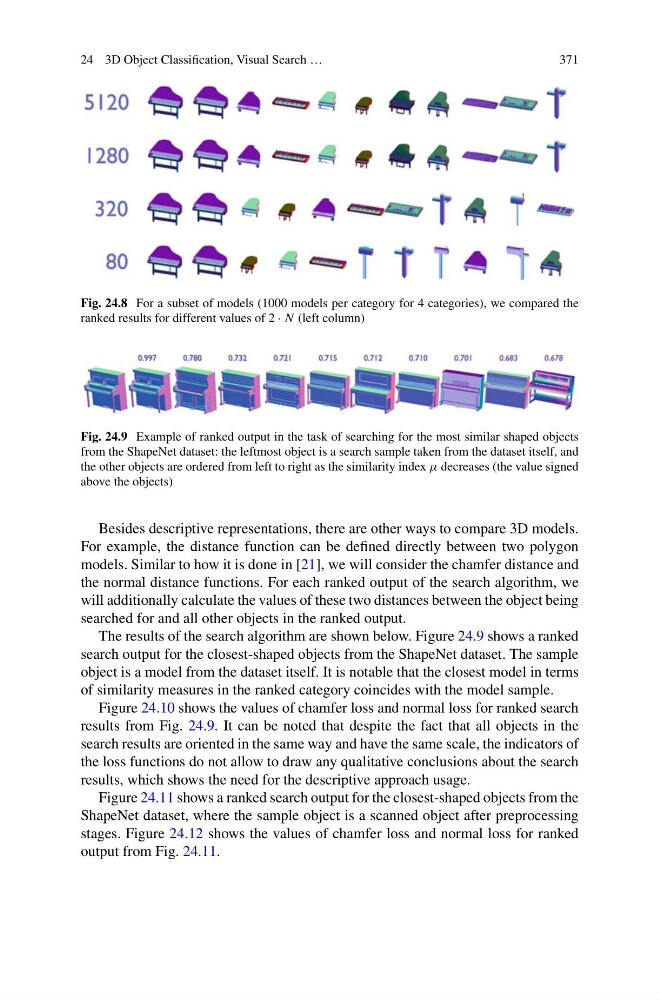
Fig. 24.8 For a subset of models (1000 models per category for 4 categories), we compared the
ranked results for different values of 2 · N (left column)
Fig. 24.9 Example of ranked output in the task of searching for the most similar shaped objects
from the ShapeNet dataset: the leftmost object is a search sample taken from the dataset itself, and
the other objects are ordered from left to right as the similarity index μ decreases (the value signed
above the objects)
Besides descriptive representations, there are other ways to compare 3D models.
For example, the distance function can be defined directly between two polygon
models. Similar to how it is done in [21], we will consider the chamfer distance and
the normal distance functions. For each ranked output of the search algorithm, we
will additionally calculate the values of these two distances between the object being
searched for and all other objects in the ranked output.
The results of the search algorithm are shown below. Figure 24.9 shows a ranked
search output for the closest-shaped objects from the ShapeNet dataset. The sample
object is a model from the dataset itself. It is notable that the closest model in terms
of similarity measures in the ranked category coincides with the model sample.
Figure 24.10 shows the values of chamfer loss and normal loss for ranked search
results from Fig. 24.9. It can be noted that despite the fact that all objects in the
search results are oriented in the same way and have the same scale, the indicators of
the loss functions do not allow to draw any qualitative conclusions about the search
results, which shows the need for the descriptive approach usage.
Figure 24.11 shows a ranked search output for the closest-shaped objects from the
ShapeNet dataset, where the sample object is a scanned object after preprocessing
stages. Figure 24.12 shows the values of chamfer loss and normal loss for ranked
output from Fig. 24.11.
371
Fig. 24.8 For a subset of models (1000 models per category for 4 categories), we compared the
ranked results for different values of 2 · N (left column)
Fig. 24.9 Example of ranked output in the task of searching for the most similar shaped objects
from the ShapeNet dataset: the leftmost object is a search sample taken from the dataset itself, and
the other objects are ordered from left to right as the similarity index μ decreases (the value signed
above the objects)
Besides descriptive representations, there are other ways to compare 3D models.
For example, the distance function can be defined directly between two polygon
models. Similar to how it is done in [21], we will consider the chamfer distance and
the normal distance functions. For each ranked output of the search algorithm, we
will additionally calculate the values of these two distances between the object being
searched for and all other objects in the ranked output.
The results of the search algorithm are shown below. Figure 24.9 shows a ranked
search output for the closest-shaped objects from the ShapeNet dataset. The sample
object is a model from the dataset itself. It is notable that the closest model in terms
of similarity measures in the ranked category coincides with the model sample.
Figure 24.10 shows the values of chamfer loss and normal loss for ranked search
results from Fig. 24.9. It can be noted that despite the fact that all objects in the
search results are oriented in the same way and have the same scale, the indicators of
the loss functions do not allow to draw any qualitative conclusions about the search
results, which shows the need for the descriptive approach usage.
Figure 24.11 shows a ranked search output for the closest-shaped objects from the
ShapeNet dataset, where the sample object is a scanned object after preprocessing
stages. Figure 24.12 shows the values of chamfer loss and normal loss for ranked
output from Fig. 24.11.