

264
N. M. Kuzmina and A. N. Ridley
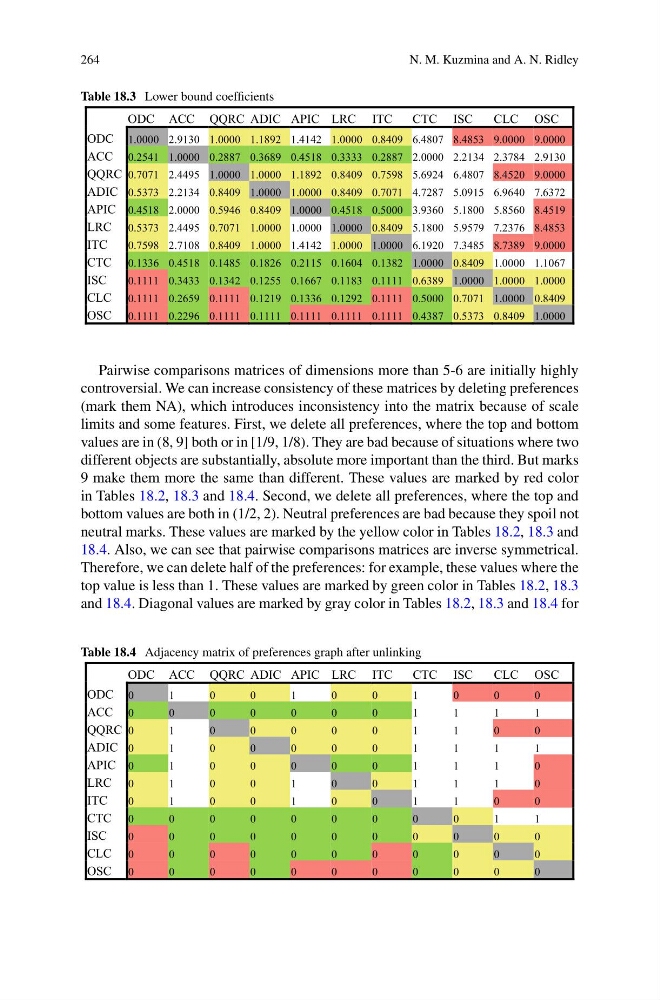
Table 18.3 Lower bound coefficients
ODC ACC QQRC ADIC APIC LRC ITC
CTC ISC
CLC OSC
ODC 1.0000 2.9130 1.0000 1.1892 1.4142 1.0000 0.8409 6.4807 8.4853 9.0000 9.0000
ACC 0.2541 1.0000 0.2887 0.3689 0.4518 0.3333 0.2887 2.0000 2.2134 2.3784 2.9130
QQRC 0.7071 2.4495 1.0000 1.0000 1.1892 0.8409 0.7598 5.6924 6.4807 8.4520 9.0000
ADIC 0.5373 2.2134 0.8409 1.0000 1.0000 0.8409 0.7071 4.7287 5.0915 6.9640 7.6372
APIC 0.4518 2.0000 0.5946 0.8409 1.0000 0.4518 0.5000 3.9360 5.1800 5.8560 8.4519
LRC 0.5373 2.4495 0.7071 1.0000 1.0000 1.0000 0.8409 5.1800 5.9579 7.2376 8.4853
ITC
0.7598 2.7108 0.8409 1.0000 1.4142 1.0000 1.0000 6.1920 7.3485 8.7389 9.0000
CTC 0.1336 0.4518 0.1485 0.1826 0.2115 0.1604 0.1382 1.0000 0.8409 1.0000 1.1067
ISC
0.1111 0.3433 0.1342 0.1255 0.1667 0.1183 0.1111 0.6389 1.0000 1.0000 1.0000
CLC 0.1111 0.2659 0.1111 0.1219 0.1336 0.1292 0.1111 0.5000 0.7071 1.0000 0.8409
OSC 0.1111 0.2296 0.1111 0.1111 0.1111 0.1111 0.1111 0.4387 0.5373 0.8409 1.0000
Pairwise comparisons matrices of dimensions more than 5-6 are initially highly
controversial. We can increase consistency of these matrices by deleting preferences
(mark them NA), which introduces inconsistency into the matrix because of scale
limits and some features. First, we delete all preferences, where the top and bottom
values are in (8, 9] both or in [1/9, 1/8). They are bad because of situations where two
different objects are substantially, absolute more important than the third. But marks
9 make them more the same than different. These values are marked by red color
in Tables 18.2, 18.3 and 18.4. Second, we delete all preferences, where the top and
bottom values are both in (1/2, 2). Neutral preferences are bad because they spoil not
neutral marks. These values are marked by the yellow color in Tables 18.2, 18.3 and
18.4. Also, we can see that pairwise comparisons matrices are inverse symmetrical.
Therefore, we can delete half of the preferences: for example, these values where the
top value is less than 1. These values are marked by green color in Tables 18.2, 18.3
and 18.4. Diagonal values are marked by gray color in Tables 18.2, 18.3 and 18.4 for
Table 18.4 Adjacency matrix of preferences graph after unlinking
ODC ACC QQRC ADIC APIC LRC ITC
CTC ISC
CLC OSC
ODC 0
1
0
0
1
0
0
1
0
0
0
ACC 0
0
0
0
0
0
0
1
1
1
1
QQRC 0
1
0
0
0
0
0
1
1
0
0
ADIC 0
1
0
0
0
0
0
1
1
1
1
APIC 0
1
0
0
0
0
0
1
1
1
0
LRC 0
1
0
0
1
0
0
1
1
1
0
ITC
0
1
0
0
1
0
0
1
1
0
0
CTC 0
0
0
0
0
0
0
0
0
1
1
ISC
0
0
0
0
0
0
0
0
0
0
0
CLC 0
0
0
0
0
0
0
0
0
0
0
OSC 0
0
0
0
0
0
0
0
0
0
0
N. M. Kuzmina and A. N. Ridley
Table 18.3 Lower bound coefficients
ODC ACC QQRC ADIC APIC LRC ITC
CTC ISC
CLC OSC
ODC 1.0000 2.9130 1.0000 1.1892 1.4142 1.0000 0.8409 6.4807 8.4853 9.0000 9.0000
ACC 0.2541 1.0000 0.2887 0.3689 0.4518 0.3333 0.2887 2.0000 2.2134 2.3784 2.9130
QQRC 0.7071 2.4495 1.0000 1.0000 1.1892 0.8409 0.7598 5.6924 6.4807 8.4520 9.0000
ADIC 0.5373 2.2134 0.8409 1.0000 1.0000 0.8409 0.7071 4.7287 5.0915 6.9640 7.6372
APIC 0.4518 2.0000 0.5946 0.8409 1.0000 0.4518 0.5000 3.9360 5.1800 5.8560 8.4519
LRC 0.5373 2.4495 0.7071 1.0000 1.0000 1.0000 0.8409 5.1800 5.9579 7.2376 8.4853
ITC
0.7598 2.7108 0.8409 1.0000 1.4142 1.0000 1.0000 6.1920 7.3485 8.7389 9.0000
CTC 0.1336 0.4518 0.1485 0.1826 0.2115 0.1604 0.1382 1.0000 0.8409 1.0000 1.1067
ISC
0.1111 0.3433 0.1342 0.1255 0.1667 0.1183 0.1111 0.6389 1.0000 1.0000 1.0000
CLC 0.1111 0.2659 0.1111 0.1219 0.1336 0.1292 0.1111 0.5000 0.7071 1.0000 0.8409
OSC 0.1111 0.2296 0.1111 0.1111 0.1111 0.1111 0.1111 0.4387 0.5373 0.8409 1.0000
Pairwise comparisons matrices of dimensions more than 5-6 are initially highly
controversial. We can increase consistency of these matrices by deleting preferences
(mark them NA), which introduces inconsistency into the matrix because of scale
limits and some features. First, we delete all preferences, where the top and bottom
values are in (8, 9] both or in [1/9, 1/8). They are bad because of situations where two
different objects are substantially, absolute more important than the third. But marks
9 make them more the same than different. These values are marked by red color
in Tables 18.2, 18.3 and 18.4. Second, we delete all preferences, where the top and
bottom values are both in (1/2, 2). Neutral preferences are bad because they spoil not
neutral marks. These values are marked by the yellow color in Tables 18.2, 18.3 and
18.4. Also, we can see that pairwise comparisons matrices are inverse symmetrical.
Therefore, we can delete half of the preferences: for example, these values where the
top value is less than 1. These values are marked by green color in Tables 18.2, 18.3
and 18.4. Diagonal values are marked by gray color in Tables 18.2, 18.3 and 18.4 for
Table 18.4 Adjacency matrix of preferences graph after unlinking
ODC ACC QQRC ADIC APIC LRC ITC
CTC ISC
CLC OSC
ODC 0
1
0
0
1
0
0
1
0
0
0
ACC 0
0
0
0
0
0
0
1
1
1
1
QQRC 0
1
0
0
0
0
0
1
1
0
0
ADIC 0
1
0
0
0
0
0
1
1
1
1
APIC 0
1
0
0
0
0
0
1
1
1
0
LRC 0
1
0
0
1
0
0
1
1
1
0
ITC
0
1
0
0
1
0
0
1
1
0
0
CTC 0
0
0
0
0
0
0
0
0
1
1
ISC
0
0
0
0
0
0
0
0
0
0
0
CLC 0
0
0
0
0
0
0
0
0
0
0
OSC 0
0
0
0
0
0
0
0
0
0
0