

166
I. S. Nikitin et al.
a
b
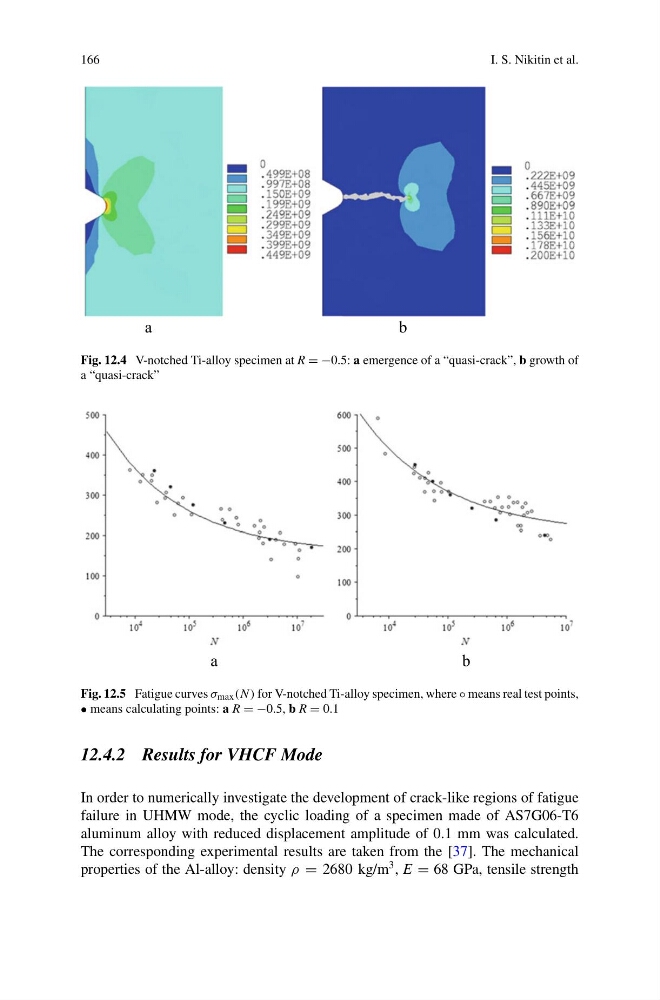
Fig. 12.4 V-notched Ti-alloy specimen at R = −0.5: a emergence of a “quasi-crack”, b growth of
a “quasi-crack”
a
b
Fig. 12.5 Fatigue curves σ max (N ) for V-notched Ti-alloy specimen, where ◦ means real test points,
• means calculating points: a R = −0.5, b R = 0.1
12.4.2 Results for VHCF Mode
In order to numerically investigate the development of crack-like regions of fatigue
failure in UHMW mode, the cyclic loading of a specimen made of AS7G06-T6
aluminum alloy with reduced displacement amplitude of 0.1 mm was calculated.
The corresponding experimental results are taken from the [37]. The mechanical
properties of the Al-alloy: density ρ = 2680 kg/m
3 , E = 68 GPa, tensile strength
I. S. Nikitin et al.
a
b
Fig. 12.4 V-notched Ti-alloy specimen at R = −0.5: a emergence of a “quasi-crack”, b growth of
a “quasi-crack”
a
b
Fig. 12.5 Fatigue curves σ max (N ) for V-notched Ti-alloy specimen, where ◦ means real test points,
• means calculating points: a R = −0.5, b R = 0.1
12.4.2 Results for VHCF Mode
In order to numerically investigate the development of crack-like regions of fatigue
failure in UHMW mode, the cyclic loading of a specimen made of AS7G06-T6
aluminum alloy with reduced displacement amplitude of 0.1 mm was calculated.
The corresponding experimental results are taken from the [37]. The mechanical
properties of the Al-alloy: density ρ = 2680 kg/m
3 , E = 68 GPa, tensile strength