

12 Multi-mode Model and Calculation Method for Fatigue Damage …
165
a
b
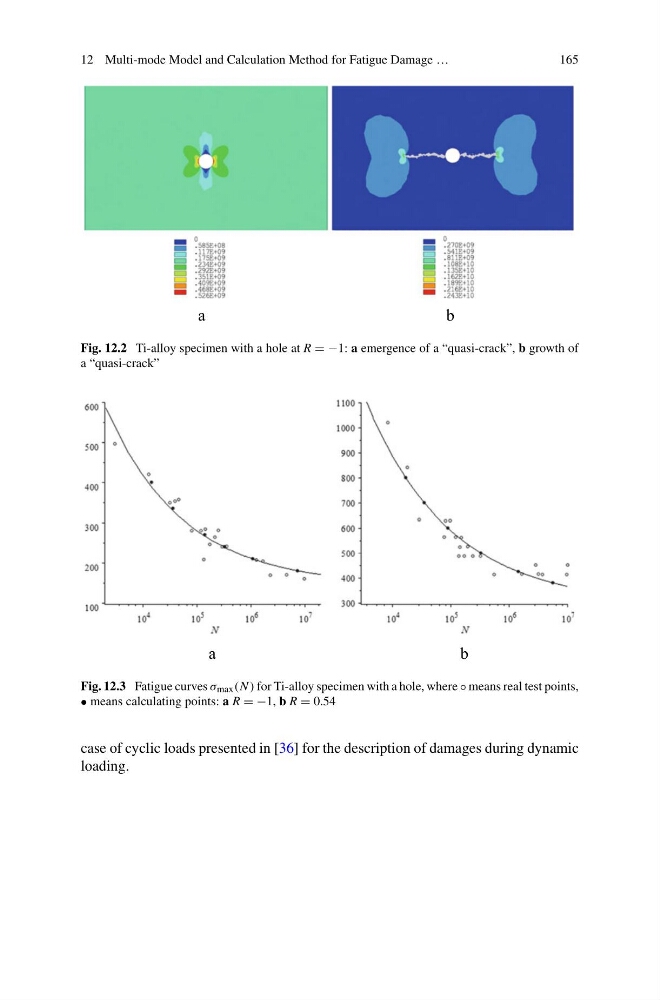
Fig. 12.2 Ti-alloy specimen with a hole at R = −1: a emergence of a “quasi-crack”, b growth of
a “quasi-crack”
a
b
Fig. 12.3 Fatigue curves σ max (N ) for Ti-alloy specimen with a hole, where ◦ means real test points,
• means calculating points: a R = −1, b R = 0.54
case of cyclic loads presented in [36] for the description of damages during dynamic
loading.
165
a
b
Fig. 12.2 Ti-alloy specimen with a hole at R = −1: a emergence of a “quasi-crack”, b growth of
a “quasi-crack”
a
b
Fig. 12.3 Fatigue curves σ max (N ) for Ti-alloy specimen with a hole, where ◦ means real test points,
• means calculating points: a R = −1, b R = 0.54
case of cyclic loads presented in [36] for the description of damages during dynamic
loading.