

8 Some Aspects on Pulsating Detonation Wave Numerical Simulation …
109
[3] gives the value near 2. To verify the realized PH chemical reaction model, the
0D homogeneous ignition simulation for the stoichiometric hydrogen–air mixture
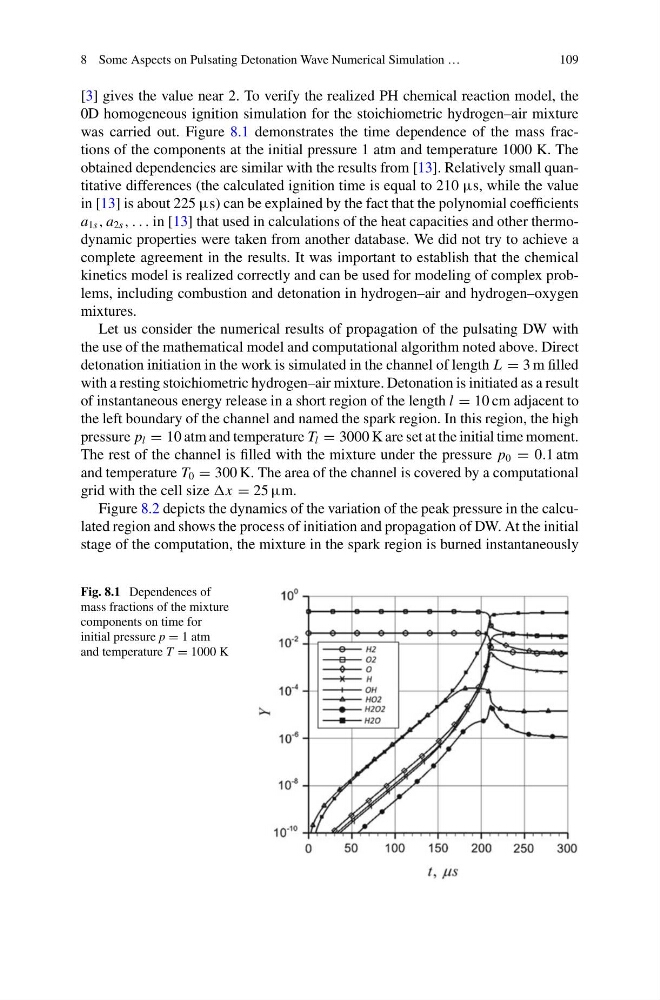
was carried out. Figure 8.1 demonstrates the time dependence of the mass fractions of the components at the initial pressure 1 atm and temperature 1000 K. The
obtained dependencies are similar with the results from [13]. Relatively small quantitative differences (the calculated ignition time is equal to 210 µs, while the value
in [13] is about 225 µs) can be explained by the fact that the polynomial coefficients
a 1s , a 2s , . . . in [13] that used in calculations of the heat capacities and other thermodynamic properties were taken from another database. We did not try to achieve a
complete agreement in the results. It was important to establish that the chemical
kinetics model is realized correctly and can be used for modeling of complex problems, including combustion and detonation in hydrogen–air and hydrogen–oxygen
mixtures.
Let us consider the numerical results of propagation of the pulsating DW with
the use of the mathematical model and computational algorithm noted above. Direct
detonation initiation in the work is simulated in the channel of length L = 3 m filled
with a resting stoichiometric hydrogen–air mixture. Detonation is initiated as a result
of instantaneous energy release in a short region of the length l = 10 cm adjacent to
the left boundary of the channel and named the spark region. In this region, the high
pressure p l = 10 atm and temperature T l = 3000 K are set at the initial time moment.
The rest of the channel is filled with the mixture under the pressure p 0 = 0.1 atm
and temperature T 0 = 300 K. The area of the channel is covered by a computational
grid with the cell size x = 25 µm.
Figure 8.2 depicts the dynamics of the variation of the peak pressure in the calculated region and shows the process of initiation and propagation of DW. At the initial
stage of the computation, the mixture in the spark region is burned instantaneously
Fig. 8.1 Dependences of
mass fractions of the mixture
components on time for
initial pressure p = 1 atm
and temperature T = 1000 K
109
[3] gives the value near 2. To verify the realized PH chemical reaction model, the
0D homogeneous ignition simulation for the stoichiometric hydrogen–air mixture
was carried out. Figure 8.1 demonstrates the time dependence of the mass fractions of the components at the initial pressure 1 atm and temperature 1000 K. The
obtained dependencies are similar with the results from [13]. Relatively small quantitative differences (the calculated ignition time is equal to 210 µs, while the value
in [13] is about 225 µs) can be explained by the fact that the polynomial coefficients
a 1s , a 2s , . . . in [13] that used in calculations of the heat capacities and other thermodynamic properties were taken from another database. We did not try to achieve a
complete agreement in the results. It was important to establish that the chemical
kinetics model is realized correctly and can be used for modeling of complex problems, including combustion and detonation in hydrogen–air and hydrogen–oxygen
mixtures.
Let us consider the numerical results of propagation of the pulsating DW with
the use of the mathematical model and computational algorithm noted above. Direct
detonation initiation in the work is simulated in the channel of length L = 3 m filled
with a resting stoichiometric hydrogen–air mixture. Detonation is initiated as a result
of instantaneous energy release in a short region of the length l = 10 cm adjacent to
the left boundary of the channel and named the spark region. In this region, the high
pressure p l = 10 atm and temperature T l = 3000 K are set at the initial time moment.
The rest of the channel is filled with the mixture under the pressure p 0 = 0.1 atm
and temperature T 0 = 300 K. The area of the channel is covered by a computational
grid with the cell size x = 25 µm.
Figure 8.2 depicts the dynamics of the variation of the peak pressure in the calculated region and shows the process of initiation and propagation of DW. At the initial
stage of the computation, the mixture in the spark region is burned instantaneously
Fig. 8.1 Dependences of
mass fractions of the mixture
components on time for
initial pressure p = 1 atm
and temperature T = 1000 K