

606
F. Abdelradi and D. Yassin
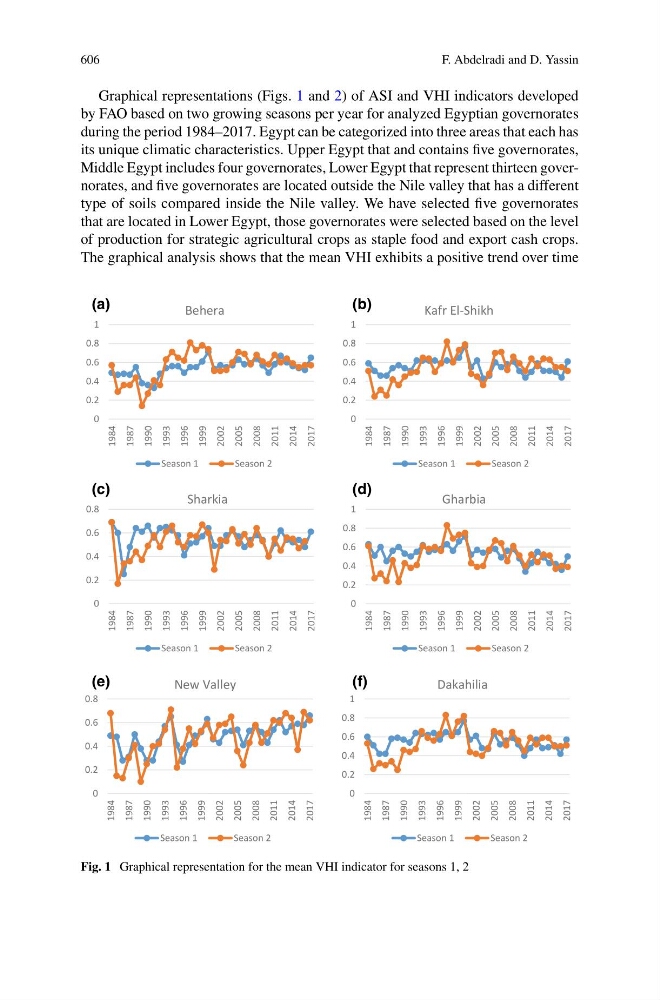
Graphical representations (Figs. 1 and 2) of ASI and VHI indicators developed
by FAO based on two growing seasons per year for analyzed Egyptian governorates
during the period 1984–2017. Egypt can be categorized into three areas that each has
its unique climatic characteristics. Upper Egypt that and contains five governorates,
Middle Egypt includes four governorates, Lower Egypt that represent thirteen governorates, and five governorates are located outside the Nile valley that has a different
type of soils compared inside the Nile valley. We have selected five governorates
that are located in Lower Egypt, those governorates were selected based on the level
of production for strategic agricultural crops as staple food and export cash crops.
The graphical analysis shows that the mean VHI exhibits a positive trend over time
0
0.2
0.4
0.6
0.8
1
1984
1987
1990
1993
1996
1999
2002
2005
2008
2011
2014
2017
Behera
Season 1
Season 2
0
0.2
0.4
0.6
0.8
1
1984
1987
1990
1993
1996
1999
2002
2005
2008
2011
2014
2017
Kafr El-Shikh
Season 1
Season 2
0
0.2
0.4
0.6
0.8
1984
1987
1990
1993
1996
1999
2002
2005
2008
2011
2014
2017
Sharkia
Season 1
Season 2
0
0.2
0.4
0.6
0.8
1
1984
1987
1990
1993
1996
1999
2002
2005
2008
2011
2014
2017
Gharbia
Season 1
Season 2
0
0.2
0.4
0.6
0.8
1984
1987
1990
1993
1996
1999
2002
2005
2008
2011
2014
2017
New Valley
Season 1
Season 2
0
0.2
0.4
0.6
0.8
1
1984
1987
1990
1993
1996
1999
2002
2005
2008
2011
2014
2017
Dakahilia
Season 1
Season 2
(a)
(b)
(c)
(d)
(e)
(f)
Fig. 1 Graphical representation for the mean VHI indicator for seasons 1, 2
F. Abdelradi and D. Yassin
Graphical representations (Figs. 1 and 2) of ASI and VHI indicators developed
by FAO based on two growing seasons per year for analyzed Egyptian governorates
during the period 1984–2017. Egypt can be categorized into three areas that each has
its unique climatic characteristics. Upper Egypt that and contains five governorates,
Middle Egypt includes four governorates, Lower Egypt that represent thirteen governorates, and five governorates are located outside the Nile valley that has a different
type of soils compared inside the Nile valley. We have selected five governorates
that are located in Lower Egypt, those governorates were selected based on the level
of production for strategic agricultural crops as staple food and export cash crops.
The graphical analysis shows that the mean VHI exhibits a positive trend over time
0
0.2
0.4
0.6
0.8
1
1984
1987
1990
1993
1996
1999
2002
2005
2008
2011
2014
2017
Behera
Season 1
Season 2
0
0.2
0.4
0.6
0.8
1
1984
1987
1990
1993
1996
1999
2002
2005
2008
2011
2014
2017
Kafr El-Shikh
Season 1
Season 2
0
0.2
0.4
0.6
0.8
1984
1987
1990
1993
1996
1999
2002
2005
2008
2011
2014
2017
Sharkia
Season 1
Season 2
0
0.2
0.4
0.6
0.8
1
1984
1987
1990
1993
1996
1999
2002
2005
2008
2011
2014
2017
Gharbia
Season 1
Season 2
0
0.2
0.4
0.6
0.8
1984
1987
1990
1993
1996
1999
2002
2005
2008
2011
2014
2017
New Valley
Season 1
Season 2
0
0.2
0.4
0.6
0.8
1
1984
1987
1990
1993
1996
1999
2002
2005
2008
2011
2014
2017
Dakahilia
Season 1
Season 2
(a)
(b)
(c)
(d)
(e)
(f)
Fig. 1 Graphical representation for the mean VHI indicator for seasons 1, 2