

Potential Climate Change Impacts on Livestock and Food Security …
427
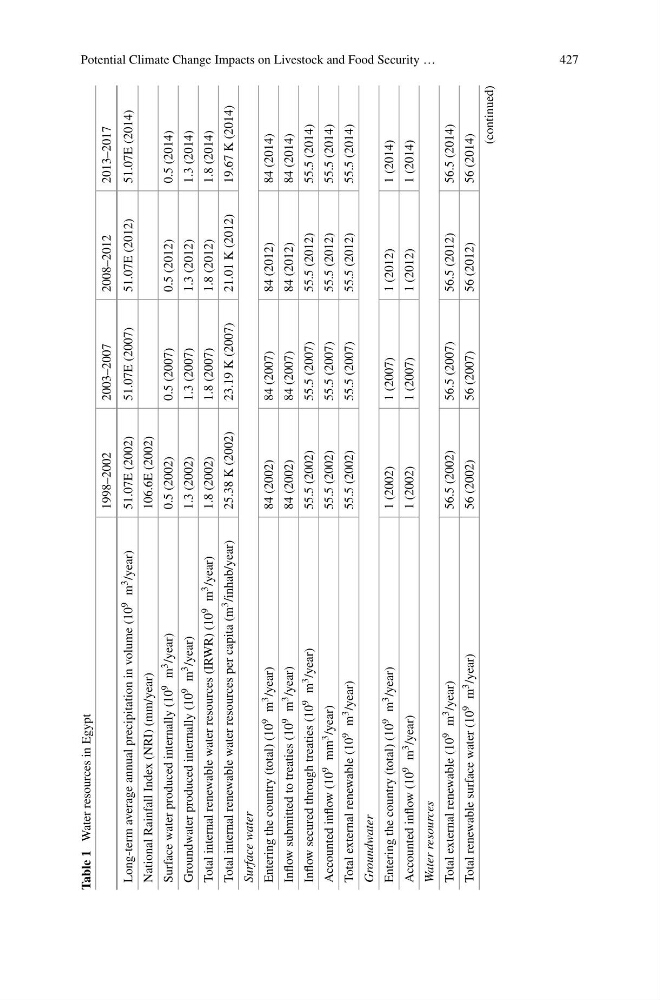
Table 1
Water resources in Egypt
1998–2002
2003–2007
2008–2012
2013–2017
Long-term average annual precipitation in volume (10 9
m 3
/year)
51.07E (2002)
51.07E (2007)
51.07E (2012)
51.07E (2014)
National Rainfall Index (NRI) (mm/year)
106.6E (2002)
Surface water produced internally (10 9
m 3
/year)
0.5 (2002)
0.5 (2007)
0.5 (2012)
0.5 (2014)
Groundwater produced internally (10 9
m 3
/year)
1.3 (2002)
1.3 (2007)
1.3 (2012)
1.3 (2014)
Total internal renewable water resources (IRWR) (10 9
m 3
/year)
1.8 (2002)
1.8 (2007)
1.8 (2012)
1.8 (2014)
Total internal renewable water resources per capita (m 3
/inhab/year)
25.38 K (2002)
23.19 K (2007)
21.01 K (2012)
19.67 K (2014)
Surface water
Entering the country (total) (10 9
m 3
/year)
84 (2002)
84 (2007)
84 (2012)
84 (2014)
Inflow submitted to treaties (10 9
m 3
/year)
84 (2002)
84 (2007)
84 (2012)
84 (2014)
Inflow secured through treaties (10 9
m 3
/year)
55.5 (2002)
55.5 (2007)
55.5 (2012)
55.5 (2014)
Accounted inflow (10 9
mm 3
/year)
55.5 (2002)
55.5 (2007)
55.5 (2012)
55.5 (2014)
Total external renewable (10 9
m 3
/year)
55.5 (2002)
55.5 (2007)
55.5 (2012)
55.5 (2014)
Groundwater
Entering the country (total) (10 9
m 3
/year)
1 (2002)
1 (2007)
1 (2012)
1 (2014)
Accounted inflow (10 9
m 3
/year)
1 (2002)
1 (2007)
1 (2012)
1 (2014)
Water resources
Total external renewable (10 9
m 3
/year)
56.5 (2002)
56.5 (2007)
56.5 (2012)
56.5 (2014)
Total renewable surface water (10 9
m 3
/year)
56 (2002)
56 (2007)
56 (2012)
56 (2014)
(continued)
427
Table 1
Water resources in Egypt
1998–2002
2003–2007
2008–2012
2013–2017
Long-term average annual precipitation in volume (10 9
m 3
/year)
51.07E (2002)
51.07E (2007)
51.07E (2012)
51.07E (2014)
National Rainfall Index (NRI) (mm/year)
106.6E (2002)
Surface water produced internally (10 9
m 3
/year)
0.5 (2002)
0.5 (2007)
0.5 (2012)
0.5 (2014)
Groundwater produced internally (10 9
m 3
/year)
1.3 (2002)
1.3 (2007)
1.3 (2012)
1.3 (2014)
Total internal renewable water resources (IRWR) (10 9
m 3
/year)
1.8 (2002)
1.8 (2007)
1.8 (2012)
1.8 (2014)
Total internal renewable water resources per capita (m 3
/inhab/year)
25.38 K (2002)
23.19 K (2007)
21.01 K (2012)
19.67 K (2014)
Surface water
Entering the country (total) (10 9
m 3
/year)
84 (2002)
84 (2007)
84 (2012)
84 (2014)
Inflow submitted to treaties (10 9
m 3
/year)
84 (2002)
84 (2007)
84 (2012)
84 (2014)
Inflow secured through treaties (10 9
m 3
/year)
55.5 (2002)
55.5 (2007)
55.5 (2012)
55.5 (2014)
Accounted inflow (10 9
mm 3
/year)
55.5 (2002)
55.5 (2007)
55.5 (2012)
55.5 (2014)
Total external renewable (10 9
m 3
/year)
55.5 (2002)
55.5 (2007)
55.5 (2012)
55.5 (2014)
Groundwater
Entering the country (total) (10 9
m 3
/year)
1 (2002)
1 (2007)
1 (2012)
1 (2014)
Accounted inflow (10 9
m 3
/year)
1 (2002)
1 (2007)
1 (2012)
1 (2014)
Water resources
Total external renewable (10 9
m 3
/year)
56.5 (2002)
56.5 (2007)
56.5 (2012)
56.5 (2014)
Total renewable surface water (10 9
m 3
/year)
56 (2002)
56 (2007)
56 (2012)
56 (2014)
(continued)