

Projected Crop Coefficients Under Climate Change in Egypt
291
0.00
0.20
0.40
0.60
0.80
1.00
1.20
1.40
2016 Kcini 2030 Kcini 2016 Kcmed 2030 Kcmed 2016 Kcend 2030 Kcend
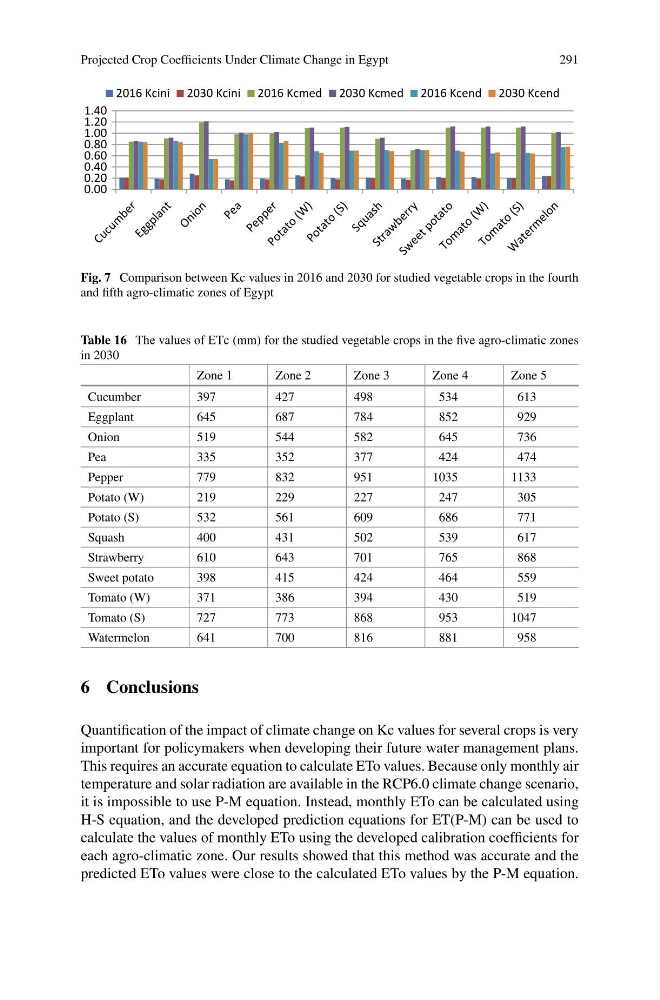
Fig. 7 Comparison between Kc values in 2016 and 2030 for studied vegetable crops in the fourth
and fifth agro-climatic zones of Egypt
Table 16 The values of ETc (mm) for the studied vegetable crops in the five agro-climatic zones
in 2030
Zone 1
Zone 2
Zone 3
Zone 4
Zone 5
Cucumber
397
427
498
534
613
Eggplant
645
687
784
852
929
Onion
519
544
582
645
736
Pea
335
352
377
424
474
Pepper
779
832
951
1035
1133
Potato (W)
219
229
227
247
305
Potato (S)
532
561
609
686
771
Squash
400
431
502
539
617
Strawberry
610
643
701
765
868
Sweet potato
398
415
424
464
559
Tomato (W)
371
386
394
430
519
Tomato (S)
727
773
868
953
1047
Watermelon
641
700
816
881
958
6 Conclusions
Quantification of the impact of climate change on Kc values for several crops is very
important for policymakers when developing their future water management plans.
This requires an accurate equation to calculate ETo values. Because only monthly air
temperature and solar radiation are available in the RCP6.0 climate change scenario,
it is impossible to use P-M equation. Instead, monthly ETo can be calculated using
H-S equation, and the developed prediction equations for ET(P-M) can be used to
calculate the values of monthly ETo using the developed calibration coefficients for
each agro-climatic zone. Our results showed that this method was accurate and the
predicted ETo values were close to the calculated ETo values by the P-M equation.
291
0.00
0.20
0.40
0.60
0.80
1.00
1.20
1.40
2016 Kcini 2030 Kcini 2016 Kcmed 2030 Kcmed 2016 Kcend 2030 Kcend
Fig. 7 Comparison between Kc values in 2016 and 2030 for studied vegetable crops in the fourth
and fifth agro-climatic zones of Egypt
Table 16 The values of ETc (mm) for the studied vegetable crops in the five agro-climatic zones
in 2030
Zone 1
Zone 2
Zone 3
Zone 4
Zone 5
Cucumber
397
427
498
534
613
Eggplant
645
687
784
852
929
Onion
519
544
582
645
736
Pea
335
352
377
424
474
Pepper
779
832
951
1035
1133
Potato (W)
219
229
227
247
305
Potato (S)
532
561
609
686
771
Squash
400
431
502
539
617
Strawberry
610
643
701
765
868
Sweet potato
398
415
424
464
559
Tomato (W)
371
386
394
430
519
Tomato (S)
727
773
868
953
1047
Watermelon
641
700
816
881
958
6 Conclusions
Quantification of the impact of climate change on Kc values for several crops is very
important for policymakers when developing their future water management plans.
This requires an accurate equation to calculate ETo values. Because only monthly air
temperature and solar radiation are available in the RCP6.0 climate change scenario,
it is impossible to use P-M equation. Instead, monthly ETo can be calculated using
H-S equation, and the developed prediction equations for ET(P-M) can be used to
calculate the values of monthly ETo using the developed calibration coefficients for
each agro-climatic zone. Our results showed that this method was accurate and the
predicted ETo values were close to the calculated ETo values by the P-M equation.