

Projected Crop Coefficients Under Climate Change in Egypt
283
0.00
0.20
0.40
0.60
0.80
1.00
1.20
1.40
2016 Kcini 2030 Kcini 2016 Kcmed 2030 Kcmed 2016 Kcend 2030 Kcend
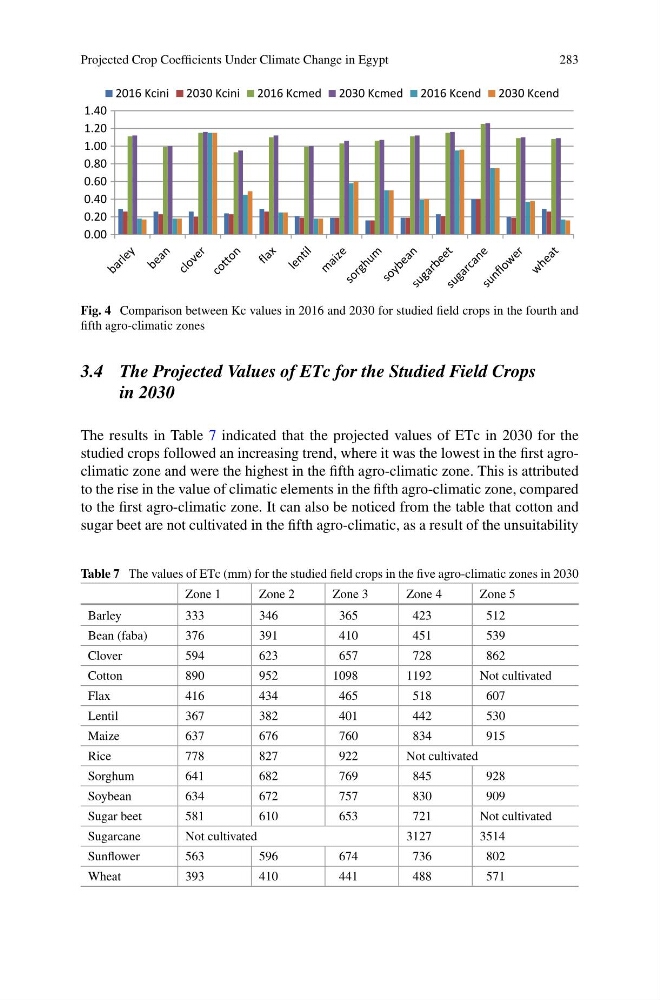
Fig. 4 Comparison between Kc values in 2016 and 2030 for studied field crops in the fourth and
fifth agro-climatic zones
3.4 The Projected Values of ETc for the Studied Field Crops
in 2030
The results in Table 7 indicated that the projected values of ETc in 2030 for the
studied crops followed an increasing trend, where it was the lowest in the first agroclimatic zone and were the highest in the fifth agro-climatic zone. This is attributed
to the rise in the value of climatic elements in the fifth agro-climatic zone, compared
to the first agro-climatic zone. It can also be noticed from the table that cotton and
sugar beet are not cultivated in the fifth agro-climatic, as a result of the unsuitability
Table 7 The values of ETc (mm) for the studied field crops in the five agro-climatic zones in 2030
Zone 1
Zone 2
Zone 3
Zone 4
Zone 5
Barley
333
346
365
423
512
Bean (faba)
376
391
410
451
539
Clover
594
623
657
728
862
Cotton
890
952
1098
1192
Not cultivated
Flax
416
434
465
518
607
Lentil
367
382
401
442
530
Maize
637
676
760
834
915
Rice
778
827
922
Not cultivated
Sorghum
641
682
769
845
928
Soybean
634
672
757
830
909
Sugar beet
581
610
653
721
Not cultivated
Sugarcane
Not cultivated
3127
3514
Sunflower
563
596
674
736
802
Wheat
393
410
441
488
571
283
0.00
0.20
0.40
0.60
0.80
1.00
1.20
1.40
2016 Kcini 2030 Kcini 2016 Kcmed 2030 Kcmed 2016 Kcend 2030 Kcend
Fig. 4 Comparison between Kc values in 2016 and 2030 for studied field crops in the fourth and
fifth agro-climatic zones
3.4 The Projected Values of ETc for the Studied Field Crops
in 2030
The results in Table 7 indicated that the projected values of ETc in 2030 for the
studied crops followed an increasing trend, where it was the lowest in the first agroclimatic zone and were the highest in the fifth agro-climatic zone. This is attributed
to the rise in the value of climatic elements in the fifth agro-climatic zone, compared
to the first agro-climatic zone. It can also be noticed from the table that cotton and
sugar beet are not cultivated in the fifth agro-climatic, as a result of the unsuitability
Table 7 The values of ETc (mm) for the studied field crops in the five agro-climatic zones in 2030
Zone 1
Zone 2
Zone 3
Zone 4
Zone 5
Barley
333
346
365
423
512
Bean (faba)
376
391
410
451
539
Clover
594
623
657
728
862
Cotton
890
952
1098
1192
Not cultivated
Flax
416
434
465
518
607
Lentil
367
382
401
442
530
Maize
637
676
760
834
915
Rice
778
827
922
Not cultivated
Sorghum
641
682
769
845
928
Soybean
634
672
757
830
909
Sugar beet
581
610
653
721
Not cultivated
Sugarcane
Not cultivated
3127
3514
Sunflower
563
596
674
736
802
Wheat
393
410
441
488
571