

H 2 O 2 þ hv ! 2HO
: O 2
ð7Þ
4.1 Effect of Catalyst Loading
The photo-Fenton process was performed with five different loadings of Fe-PILC,
i.e., 0.4, 0.5, 0.6, 0.7, and 0.8 g Fe-PILC/L with a reaction time of 180 min. It can be
observed in Fig. 5 that the smallest mineralization degree and rate were with a
catalyst loading of 0.4 g/L. This can be ascribed to a low generation of hydroxyl
radicals due to a small amount of Fe to catalyze hydrogen peroxide dissociation
[38]. There were not significant differences with other catalyst loadings indicating
that degradation exhibits the same oxidation resistance [39]. Still, if initial reaction
rates are calculated (Fig. 5b), it can be observed that the best initial reaction rate is
attained with a loading of 0.5 g/L and that initial reaction rate decreases after this
catalyst dosage. This can be ascribed to an increase on turbidity that causes a
reduction in UV light absorption, consequently decreasing the photoreduction of
Fe(III) (reaction 6) [34, 40, 41]. The effect of this variable gives evidence that
resistance to mass transfer from liquid to solid is negligible.
0
5
10
15
20
25
30
35
40
Photo-fenton
Fenton
Photo-catalysis
H
2
O
2
(stoich) + UV
Photolysis (UV)
λ=254 nm
H
2
O
2
(stoich)
)
L
/
g
6
.
0
(
t
s
y
l
a
t
a
C
0%
0%
)
%
(
n
o
i
t
a
z
i
l
a
r
e
n
i
M
0%
4.0%
2.0%
5.0%
31.0%
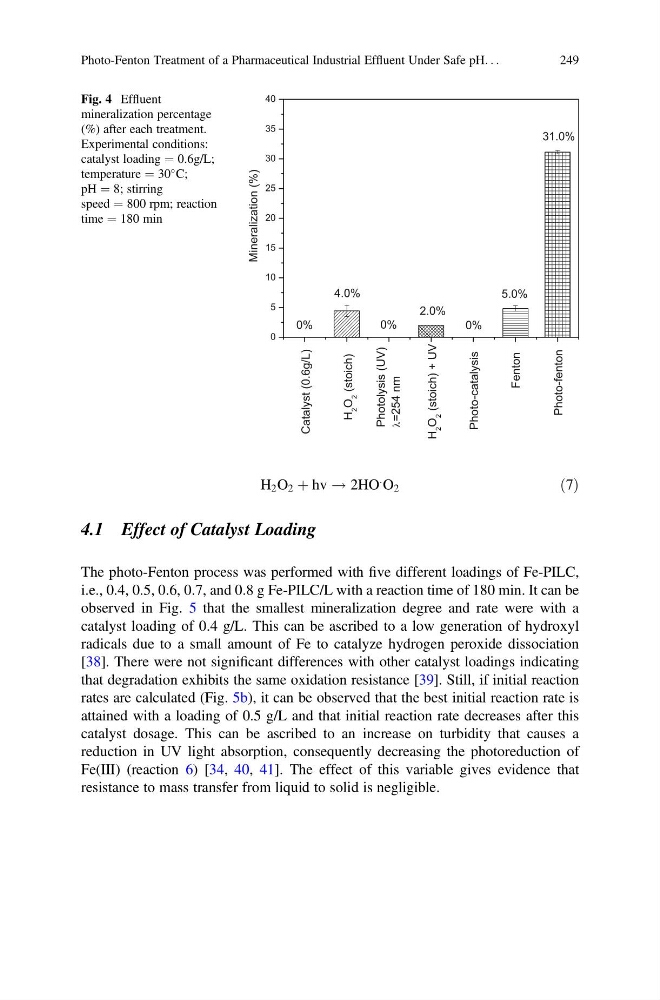
Fig. 4 Effluent
mineralization percentage
(%) after each treatment.
Experimental conditions:
catalyst loading ¼ 0.6g/L;
temperature ¼ 30
C;
pH ¼ 8; stirring
speed ¼ 800 rpm; reaction
time ¼ 180 min
Photo-Fenton Treatment of a Pharmaceutical Industrial Effluent Under Safe pH. . .
249
: O 2
ð7Þ
4.1 Effect of Catalyst Loading
The photo-Fenton process was performed with five different loadings of Fe-PILC,
i.e., 0.4, 0.5, 0.6, 0.7, and 0.8 g Fe-PILC/L with a reaction time of 180 min. It can be
observed in Fig. 5 that the smallest mineralization degree and rate were with a
catalyst loading of 0.4 g/L. This can be ascribed to a low generation of hydroxyl
radicals due to a small amount of Fe to catalyze hydrogen peroxide dissociation
[38]. There were not significant differences with other catalyst loadings indicating
that degradation exhibits the same oxidation resistance [39]. Still, if initial reaction
rates are calculated (Fig. 5b), it can be observed that the best initial reaction rate is
attained with a loading of 0.5 g/L and that initial reaction rate decreases after this
catalyst dosage. This can be ascribed to an increase on turbidity that causes a
reduction in UV light absorption, consequently decreasing the photoreduction of
Fe(III) (reaction 6) [34, 40, 41]. The effect of this variable gives evidence that
resistance to mass transfer from liquid to solid is negligible.
0
5
10
15
20
25
30
35
40
Photo-fenton
Fenton
Photo-catalysis
H
2
O
2
(stoich) + UV
Photolysis (UV)
λ=254 nm
H
2
O
2
(stoich)
)
L
/
g
6
.
0
(
t
s
y
l
a
t
a
C
0%
0%
)
%
(
n
o
i
t
a
z
i
l
a
r
e
n
i
M
0%
4.0%
2.0%
5.0%
31.0%
Fig. 4 Effluent
mineralization percentage
(%) after each treatment.
Experimental conditions:
catalyst loading ¼ 0.6g/L;
temperature ¼ 30
C;
pH ¼ 8; stirring
speed ¼ 800 rpm; reaction
time ¼ 180 min
Photo-Fenton Treatment of a Pharmaceutical Industrial Effluent Under Safe pH. . .
249